Download

1 / 10
100 likes | 121 Views
Modeling Real-World Data. Essential Questions. How do we apply functions to problem situations? How do we use mathematical models to make predictions?. Holt McDougal Algebra 2. Holt Algebra 2.

E N D
Modeling Real-World Data Essential Questions • How do we apply functions to problem situations? • How do we use mathematical models to make predictions? Holt McDougal Algebra 2 Holt Algebra 2
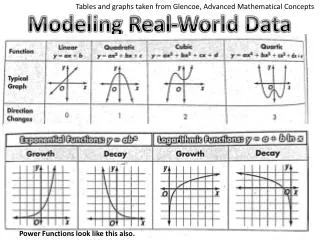
Much of the data that you encounter in the real world may form a pattern. Many times the pattern of the data can be modeled by one of the functions you have studied. You can then use the functions to analyze trends and make predictions. Recall some of the parent functions that you have studied so far.
Helpful Hint Because the square-root function is the inverse of the quadratic function, the constant differences for x- and y-values are switched.
Identifying Models by Using Constant Differences or Ratios Use constant differences or ratios to determine which parent function would best model the given data set. The x-values increase by a constant 5. Find the differences of the y-values. 1. First differences: 35 35 35 35 The first differences are constant. A linear polynomial best describes the data.
Identifying Models by Using Constant Differences or Ratios Use constant differences or ratios to determine which parent function would best model the given data set. The x-values increase by a constant 4. Find the differences of the y-values. 2. First differences: -400 -384 -369 -354 Second differences: 15 16 15 Ratio: The ratios are constant. An exponential function best describes the data.
Identifying Models by Using Constant Differences or Ratios Use constant differences or ratios to determine which parent function would best model the given data set. The x-values increase by a constant 1. Find the differences of the y-values. 3. First differences: 33 -11 -55 -99 Second differences: -44 -44 -44 The second differences are constant. A quadratic polynomial best describes the data.
Identifying Models by Using Constant Differences or Ratios Use constant differences or ratios to determine which parent function would best model the given data set. The y-values increase by a constant 10. Find the differences of the x-values. 4. 108 First differences: 36 60 84 24 Second differences: 24 24 The second x-value differences are constant. A square root function best describes the data.
Identifying Models by Using Constant Differences or Ratios Use constant differences or ratios to determine which parent function would best model the given data set. The x-values increase by a constant 1. Find the differences of the y-values. 5. First differences: 81 108 144 Second differences: 27 36 Ratio: The ratios are constant. An exponential function best describes the data.