Download
1 / 75
750 likes | 784 Views
Econometrics 2 - Lecture 1 ML Estimation, Diagnostic Tests. Contents. Organizational Issues Linear Regression: A Review Estimation of Regression Parameters Estimation Concepts ML Estimator: Idea and Illustrations ML Estimator: Notation and Properties ML Estimator: Two Examples

E N D
Contents • Organizational Issues • Linear Regression: A Review • Estimation of Regression Parameters • Estimation Concepts • ML Estimator: Idea and Illustrations • ML Estimator: Notation and Properties • ML Estimator: Two Examples • Asymptotic Tests • Some Diagnostic Tests Hackl, Econometrics 2, Lecture 1
Organizational Issues Course schedule (proposal) Classes start at 10:00 Hackl, Econometrics 2, Lecture 1
Organizational Issues, cont’d Teaching and learning method • Course in six blocks • Class discussion, written homework (computer exercises, GRETL) submitted by groups of (3-5) students, presentations of homework by participants • Final exam Assessment of student work • For grading, the written homework, presentation of homework in class and a final written exam will be of relevance • Weights: homework 40 %, final written exam 60 % • Presentation of homework in class: students must be prepared to be called at random Hackl, Econometrics 2, Lecture 1
Organizational Issues, cont’d Literature Course textbook • Marno Verbeek, A Guide to Modern Econometrics, 3rd Ed., Wiley, 2008 Suggestions for further reading • W.H. Greene, Econometric Analysis. 7th Ed., Pearson International, 2012 • R.C. Hill, W.E. Griffiths, G.C. Lim, Principles of Econometrics, 4th Ed., Wiley, 2012 Hackl, Econometrics 2, Lecture 1
Aims and Content Aims of the course • Deepening the understanding of econometric concepts and principles • Learning about advanced econometric tools and techniques • ML estimation and testing methods (MV, Cpt. 6) • Models for limited dependent variables (MV, Cpt. 7) • Time series models (MV, Cpt. 8, 9) • Multi-equation models (MV, Cpt. 9) • Panel data models (MV, Cpt. 10) • Use of econometric tools for analyzing economic data: specification of adequate models, identification of appropriate econometric methods, interpretation of results • Use of GRETL Hackl, Econometrics 2, Lecture 1
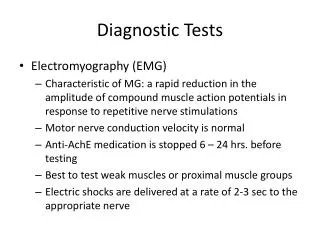
Limited Dependent Variables: An Example Explain whether a household owns a car: explanatory power have • income • household size • etc. Regression is not suitable! WHY? Hackl, Econometrics 2, Lecture 1
Limited Dependent Variables: An Example Explain whether a household owns a car: explanatory power have • income • household size • etc. Regression is not suitable! • Owning a car has two manifestations: yes/no • Indicator for owning a car is a binary variable Models are needed that allow to describe a binary dependent variable or a, more generally, limited dependent variable Hackl, Econometrics 2, Lecture 1
Cases of Limited Dependent Variable Typical situations: functions of explanatory variables are used to describe or explain • Dichotomous dependent variable, e.g., ownership of a car (yes/no), employment status (employed/unemployed), etc. • Ordered response, e.g., qualitative assessment (good/average/bad), working status (full-time/part-time/not working), etc. • Multinomial response, e.g., trading destinations (Europe/Asia/Africa), transportation means (train/bus/car), etc. • Count data, e.g., number of orders a company receives in a week, number of patents granted to a company in a year • Censored data, e.g., expenditures for durable goods, duration of study with drop outs Hackl, Econometrics 2, Lecture 1
Time Series Example: Price/Earnings Ratio Verbeek’s data set PE: PE = ratio of S&P composite stock price index and S&P composite earnings of the S&P500, annual, 1871-2002 • Is the PE ration mean reverting? • log(PE) • Mean 2.63 (PE: 13,9) • Min 1.81 • Max 3.60 • Std 0.33 Hackl, Econometrics 2, Lecture 1
Time Series Models Types of model specification • Deterministic trend: a function f(t) of the time, describing the evolution of E{Yt} over time Yt = f(t) + εt, εt: white noise e.g., Yt = α + βt + εt • Autoregression AR(1) Yt = δ + θYt-1 + εt, |θ| < 1, εt: white noise generalization: ARMA(p,q)-process Yt = θ1Yt-1 + … + θpYt-p + εt + α1εt-1 + … + αqεt-q Purpose of modelling: • Description of the data generating process • Forecasting Hackl, Econometrics 2, Lecture 1
PE Ratio: Various Models Diagnostics for various competing models: Δyt = log PEt - log PEt-1 Best fit for • BIC: MA(2) model Δyt = 0.008 + et – 0.250 et-2 • AIC: AR(2,4) model Δyt = 0.008 – 0.202 Δyt-2 – 0.211 Δyt-4 + et • Q12: Box-Ljung statistic for the first 12 autocorrelations Hackl, Econometrics 2, Lecture 1
Multi-equation Models • Economic processes: Simultaneous and interrelated development of a set of variables • Examples: • Households consume a set of commodities (food, durables, etc.); the demanded quantities depend on the prices of commodities, the household income, the number of persons living in the household, etc.; a consumption model includes a set of dependent variables and a common set of explanatory variables. • The market of a product is characterized by (a) the demanded and supplied quantity and (b) the price of the product; a model for the market consists of equations representing the development and interdependencies of these variables. • An economy consists of markets for commodities, labour, finances, etc.; a model for a sector or the full economy contains descriptions of the development of the relevant variables and their interactions. Hackl, Econometrics 2, Lecture 1
Panel Data Population of interest: individuals, households, companies, countries Types of observations • Cross-sectional data: Observations of all units of a population, or of a (representative) subset, at one specific point in time • Time series data: Series of observations on units of the population over a period of time • Panel data (longitudinal data): Repeated observations of (the same) population units collected over a number of periods; data set with both a cross-sectional and a time series aspect; multi-dimensional data Cross-sectional and time series data are special cases of panel data Hackl, Econometrics 2, Lecture 1
Panel Data Example: Individual Wages Verbeek’s data set “males” • Sample of • 545 full-time working males • each person observed yearly after completion of school in 1980 till 1987 • Variables • wage: log of hourly wage (in USD) • school: years of schooling • exper: age – 6 – school • dummies for union membership, married, black, Hispanic, public sector • others Hackl, Econometrics 2, Lecture 1
Panel Data Models Panel data models • Allow controlling individual differences, comparing behaviour, analysing dynamic adjustment, measuring effects of policy changes • More realistic models than cross-sectional and time-series models • Allow more detailed or sophisticated research questions E.g.: What is the effect of being married on the hourly wage Hackl, Econometrics 2, Lecture 1
Contents • Organizational Issues • Linear Regression: A Review • Estimation of Regression Parameters • Estimation Concepts • ML Estimator: Idea and Illustrations • ML Estimator: Notation and Properties • ML Estimator: Two Examples • Asymptotic Tests • Some Diagnostic Tests Hackl, Econometrics 2, Lecture 1
The Linear Model Y: explained variable X: explanatory or regressor variable The model describes the data-generating process of Y under the condition X A simple linear regression model Y = a + bX b: coefficient of X a: intercept A multiple linear regression model Y = b1 + b2X2 + … + bKXK Hackl, Econometrics 2, Lecture 1
Fitting a Model to Data Choice of values b1, b2 for model parameters b1, b2 of Y = b1 + b2 X, given the observations (yi, xi), i = 1,…,N Model for observations: yi = b1 + b2 xi + εi, i = 1,…,N Fitted values: ŷi = b1 + b2 xi, i = 1,…,N Principle of (Ordinary) Least Squares gives the OLS estimators bi = arg minb1,b2 S(b1, b2), i=1,2 Objective function: sum of the squared deviations S(b1, b2) = Si [yi - (b1 + b2xi)]2 = Si εi2 Deviations between observation and fitted values, residuals: ei = yi - ŷi = yi - (b1 + b2xi) Hackl, Econometrics 2, Lecture 1
Observations and Fitted Regression Line Simple linear regression: Fitted line and observation points (Verbeek, Figure 2.1) Hackl, Econometrics 2, Lecture 1
Contents • Organizational Issues • Linear Regression: A Review • Estimation of Regression Parameters • Estimation Concepts • ML Estimator: Idea and Illustrations • ML Estimator: Notation and Properties • ML Estimator: Two Examples • Asymptotic Tests • Some Diagnostic Tests Hackl, Econometrics 2, Lecture 1
OLS Estimators Equating the partial derivatives of S(b1, b2) to zero: normal equations OLS estimators b1 und b2 result in with mean values and and second moments Hackl, Econometrics 2, Lecture 1
OLS Estimators: The General Case Model for Y contains K-1 explanatory variables Y = b1 + b2X2 + … + bKXK = x’b with x = (1, X2, …, XK)’ and b = (b1, b2, …, bK)’ Observations: [yi, xi] = [yi, (1, xi2, …, xiK)’], i = 1, …, N OLS-estimates b = (b1, b2, …, bK)’ are obtained by minimizing this results in the OLS estimators Hackl, Econometrics 2, Lecture 1
Matrix Notation N observations (y1,x1), … , (yN,xN) Model:yi = b1 + b2xi + εi, i = 1, …,N, or y = Xb+ ε with OLS estimators b = (X’X)-1X’y Hackl, Econometrics 2, Lecture 1
Gauss-Markov Assumptions • Observation yi(i = 1, …, N) is a linear function yi = xi'b + εi • of observations xik, k =1, …, K, of the regressor variables and the error term εi • xi = (xi1, …, xiK)'; X = (xik) Hackl, Econometrics 2, Lecture 1
Normality of Error Terms Together with assumptions (A1), (A3), and (A4), (A5) implies εi~ NID(0,σ2) for all i i.e., all εi are • independent drawings • from the normal distribution N(0,σ2) • with mean 0 • and variance σ2 Error terms are “normally and independently distributed” (NID, n.i.d.) Hackl, Econometrics 2, Lecture 1
Properties of OLS Estimators OLS estimator b = (X’X)-1X’y 1. The OLS estimator b is unbiased: E{b} = β 2. The variance of the OLS estimator is given by V{b} = σ2(Σixixi’ )-1 3. The OLS estimator bis a BLUE (best linear unbiased estimator) for β 4. The OLS estimator b is normally distributed with mean β and covariance matrix V{b} = σ2(Σixixi’ )-1 Properties • 1., 2., and 3. follow from Gauss-Markov assumptions • 4. needs in addition the normality assumption (A5) Hackl, Econometrics 2, Lecture 1
Distribution of t-statistic t-statistic follows • the t-distribution with N-Kd.f. if the Gauss-Markov assumptions (A1) - (A4) and the normality assumption (A5) hold • approximately the t-distribution with N-Kd.f. if the Gauss-Markov assumptions (A1) - (A4) hold but not the normality assumption (A5) • asymptotically (N →∞) the standard normal distribution N(0,1) • Approximately, for large N, the standard normal distribution N(0,1) The approximation errors decrease with increasing sample size N Hackl, Econometrics 2, Lecture 1
OLS Estimators: Consistency The OLS estimators b are consistent, plimN →∞ b = β, if one of the two sets of conditions are fulfilled: • (A2) from the Gauss-Markov assumptions and the assumption (A6), or • the assumption (A7), weaker than (A2), and the assumption (A6) Assumptions (A6) and (A7): Assumption (A7) is weaker than assumption (A2)! Hackl, Econometrics 2, Lecture 1
Contents • Organizational Issues • Linear Regression: A Review • Estimation of Regression Parameters • Estimation Concepts • ML Estimator: Idea and Illustrations • ML Estimator: Notation and Properties • ML Estimator: Two Examples • Asymptotic Tests • Some Diagnostic Tests Hackl, Econometrics 2, Lecture 1
Estimation Concepts • OLS estimator: Minimization of objective function S(b) = Si εi2gives • K first-order conditions Si (yi – xi’b)xi = Si eixi = 0, the normal equations • OLS estimators are solutions of the normal equations • Moment conditions • E{(yi – xi’ b)xi} = E{eixi} = 0 • Normal equations are sample moment conditions (times N) • IV estimator: Model allows derivation of moment conditions • E{(yi – xi’ b)zi} = E{eizi} = 0 • which are functions of • observable variables yi, xi, instrument variables zi, and unknown parameters b • Moment conditions are used for deriving IV estimators • OLS estimators are special case of IV estimators Hackl, Econometrics 2, Lecture 1
Estimation Concepts, cont’d GMM estimator: generalization of the moment conditions E{f(wi, zi, b)} = 0 • with observable variables wi, instrument variables zi, and unknown parameters b; f: multidimensional function with as many components as conditions • Allows for non-linear models • Under weak regularity conditions, the GMM estimators are • consistent • asymptotically normal • Maximum likelihood estimation • Basis is the distribution of yi conditional on regressors xi • Depends on unknown parameters b • The estimates of the parameters bare chosen so that the distribution corresponds as well as possible to the observations yi and xi Hackl, Econometrics 2, Lecture 1
Contents • Organizational Issues • Linear Regression: A Review • Estimation of Regression Parameters • Estimation Concepts • ML Estimator: Idea and Illustrations • ML Estimator: Notation and Properties • ML Estimator: Two Examples • Asymptotic Tests • Some Diagnostic Tests Hackl, Econometrics 2, Lecture 1
Example: Urn Experiment • Urn experiment: • The urn contains red and white balls • Proportion of red balls: p (unknown) • N random draws • Random draw i: yi= 1 if ball in draw i is red, yi= 0 otherwise; P{yi=1} = p • Sample: N1 red balls, N-N1 white balls • Probability for this result: • P{N1 red balls, N-N1 white balls} ≈ pN1 (1 – p)N-N1 • Likelihood function L(p): The probability of the sample result, interpreted as a function of the unknown parameter p Hackl, Econometrics 2, Lecture 1
Urn Experiment: Likelihood Function and LM Estimator Likelihood function: (proportional to) the probability of the sample result, interpreted as a function of the unknown parameter p L(p) = pN1 (1 – p)N-N1 , 0 < p < 1 Maximum likelihood estimator: that value of p which maximizes L(p) Calculation of : maximization algorithms • As the log-function is monotonous, coordinates p of the extremes of L(p) and log L(p) coincide • Use of log-likelihood function is often more convenient log L(p) = N1 log p + (N - N1) log (1 – p) Hackl, Econometrics 2, Lecture 1
Urn Experiment: Likelihood Function, cont’d Verbeek, Fig.6.1 Hackl, Econometrics 2, Lecture 1
Urn Experiment: ML Estimator Maximizing log L(p) with respect to p gives the first-order condition Solving this equation for p gives the maximum likelihood estimator (ML estimator) For N = 100, N1 = 44, the ML estimator for the proportion of red balls is = 0.44 Hackl, Econometrics 2, Lecture 1
Maximum Likelihood Estimator: The Idea • Specify the distribution of the data (of y or y given x) • Determine the likelihood of observing the available sample as a function of the unknown parameters • Choose as ML estimates those values for the unknown parameters that give the highest likelihood • Properties: In general, the ML estimators are • consistent • asymptotically normal • efficient provided the likelihood function is correctly specified, i.e., distributional assumptions are correct Hackl, Econometrics 2, Lecture 1
Example: Normal Linear Regression Model yi = β1 + β2Xi + εi with assumptions (A1) – (A5) From the normal distribution of εi follows: contribution of observation i to the likelihood function: L(β,σ²) = ∏if(yi│xi;β,σ²) due to independent observations; the log-likelihood function is given by Hackl, Econometrics 2, Lecture 1
Normal Linear Regression, cont’d Maximizing log L(β,σ²) with respect to β and σ2 gives the ML estimators which coincide with the OLS estimators, and which is biased and underestimates σ²! Remarks: • The results are obtained assuming normally and independently distributed (NID) error terms • ML estimators are consistent but not necessarily unbiased; see the properties of ML estimators below Hackl, Econometrics 2, Lecture 1
Contents • Organizational Issues • Linear Regression: A Review • Estimation of Regression Parameters • Estimation Concepts • ML Estimator: Idea and Illustrations • ML Estimator: Notation and Properties • ML Estimator: Two Examples • Asymptotic Tests • Some Diagnostic Tests Hackl, Econometrics 2, Lecture 1
ML Estimator: Notation • Let the density (or probability mass function) of yi, given xi, be given by f(yi|xi,θ) with K-dimensional vector θ of unknown parameters • Given independent observations, the likelihood function for the sample of size N is • The ML estimators are the solutions of • maxθlog L(θ) = maxθΣilog Li(θ) • or the solutions of the K first-order conditions • s(θ) = Σisi(θ), the K-vector of gradients, also denoted score vector • Solution of s(θ) = 0 • analytically (see examples above) or • by use of numerical optimization algorithms Hackl, Econometrics 2, Lecture 1
Matrix Derivatives • The scalar-valued function • or – shortly written as log L(θ) – has the K arguments θ1, …, θK • K-vector of partial derivatives or gradient vector or score vector or gradient • KxK matrix of second derivatives or Hessian matrix Hackl, Econometrics 2, Lecture 1
ML Estimator: Properties The ML estimator is Consistent asymptotically efficient asymptotically normally distributed: V: asymptotic covariance matrix of Hackl, Econometrics 2, Lecture 1
The Information Matrix • Information matrix I(θ) • I(θ) is the limit (for N → ∞) of • For the asymptotic covariance matrix V can be shown: V = I(θ)-1 • I(θ)-1 is the lower bound of the asymptotic covariance matrix for any consistent, asymptotically normal estimator for θ: Cramèr-Rao lower bound • Calculation of Ii(θ) can also be based on the outer product of the score vector • for a miss-specified likelihood function, Ji(θ) can deviate from Ii(θ) Hackl, Econometrics 2, Lecture 1
Example: Normal Linear Regression Model yi = β1 + β2Xi + εi with assumptions (A1) – (A5) fulfilled The score vector with respect to β = (β1,β2)’ is – using xi = (1, Xi)’ – The information matrix is obtained both via Hessian and outer product Hackl, Econometrics 2, Lecture 1
Covariance Matrix V: Calculation Two ways to calculate V: • Estimator based on the information matrix I(θ) index “H”: the estimate of V is based on the Hessian matrix • Estimator based on the score vector with score vector s(θ); index “G”: the estimate of V is based on gradients • also called: OPG (outer product of gradient) estimator • also called: BHHH (Berndt, Hall, Hall, Hausman) estimator • E{si(θ)si(θ)’} coincides with Ii(θ) if f(yi| xi,θ) is correctly specified Hackl, Econometrics 2, Lecture 1
Contents • Organizational Issues • Linear Regression: A Review • Estimation of Regression Parameters • Estimation Concepts • ML Estimator: Idea and Illustrations • ML Estimator: Notation and Properties • ML Estimator: Two Examples • Asymptotic Tests • Some Diagnostic Tests Hackl, Econometrics 2, Lecture 1
Again the Urn Experiment Likelihood contribution of the i-th observation log Li(p) = yilog p + (1 - yi) log (1 – p) This gives scores and With E{yi} = p, the expected value turns out to be The asymptotic variance of the ML estimator V = I-1 = p(1-p) Hackl, Econometrics 2, Lecture 1
Urn Experiment and Binomial Distribution The asymptotic distribution is • Small sample distribution: N~ B(N, p) • Use of the approximate normal distribution for portions • rule of thumb for using the approximate distribution N p(1-p) > 9 Test of H0: p = p0 can be based on test statistic Hackl, Econometrics 2, Lecture 1