Download
1 / 33
330 likes | 484 Views
Linkage Analysis: An Introduction. Pak Sham Twin Workshop 2001. Linkage Mapping. Compares inheritance pattern of trait with the inheritance pattern of chromosomal regions First gene-mapping in 1913 (Sturtevant) Uses naturally occurring DNA variation (polymorphisms) as genetic markers

E N D
Linkage Analysis:An Introduction Pak Sham Twin Workshop 2001
Linkage Mapping • Compares inheritance pattern of trait with the inheritance pattern of chromosomal regions • First gene-mapping in 1913 (Sturtevant) • Uses naturally occurring DNA variation (polymorphisms) as genetic markers • >400 Mendelian (single gene) disorders mapped • Current challenge is to map QTLs
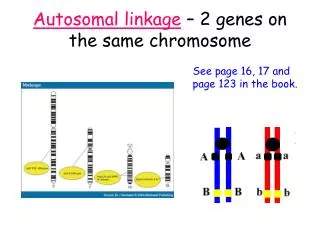
Linkage = Co-segregation A3A4 A1A2 A1A3 A2A4 A2A3 Marker allele A1 cosegregates with dominant disease A1A2 A1A4 A3A4 A3A2
Recombination A1 Q1 Parental genotypes A1 Q1 A2 Q2 Likely gametes (Non-recombinants) A2 Q2 A1 Q2 Unlikely gametes (Recombinants) Q1 A2
(1-1)(1-2) (1-1)2 1(1-2) 12 Recombination of three linked loci 1 2
Map distance Map distance between two loci (Morgans) = Expected number of crossovers per meiosis Note: Map distances are additive
Recombination & map distance Haldane map function
Methods of Linkage Analysis • Model-based lod scores • Assumes explicit trait model • Model-free allele sharing methods • Affected sib pairs • Affected pedigree members • Quantitative trait loci • Variance-components models
Double Backcross :Fully Informative Gametes aabb AABB aabb AaBb Aabb AaBb aabb aaBb Non-recombinant Recombinant
Linkage Analysis :Fully Informative Gametes Count Data Recombinant Gametes: R Non-recombinant Gametes: N Parameter Recombination Fraction: Likelihood L() = R (1- )N Parameter Chi-square
Phase Unknown Meioses aabb AaBb Aabb AaBb aabb aaBb Either : Non-recombinant Recombinant Or : Recombinant Non-recombinant
Linkage Analysis :Phase-unknown Meioses Count Data Recombinant Gametes: X Non-recombinant Gametes: Y or Recombinant Gametes: Y Non-recombinant Gametes: X Likelihood L() = X (1- )Y + Y (1- )X An example of incomplete data : Mixture distribution likelihood function
Parental genotypes unknown Aabb AaBb aabb aaBb Likelihood will be a function of allele frequencies (population parameters) (transmission parameter)
Trait phenotypes Penetrance parameters Phenotype Genotype f2 AA Disease f1 1- f2 f0 Aa 1- f1 1- f0 aa Normal Each phenotype is compatible with multiple genotypes.
General Pedigree Likelihood Likelihood is a sum of products (mixture distribution likelihood) number of terms = (m1, m2 …..mk)2n where mj is number of alleles at locus j
1 2 X Elston-Stewart algorithm Reduces computations by Peeling: Step 1 Condition likelihoods of family 1 on genotype of X. Step 2 Joint likelihood of families 2 and 1
Lod Score: Morton (1955) Lod > 3 conclude linkage Prior odds linkage ratio Posterior odds 1:50 1000 20:1 Lod <-2 exclude linkage
Linkage AnalysisAdmixture Test Model Probabilty of linkage in family = Likelihood L(, ) = L()+ (1- )L(=1/2)
Allele sharing (non-parametric) methods Penrose (1935): Sib Pair linkage For rare disease IBD Concordant affected Concordant normal Discordant Therefore Affected sib pair design Test H0: Proportion of alleles IBD =1/2
Affected sib pairs: incomplete marker information Parameters: IBD sharing probabilities Z=(z0, z1,z2) Marker Genotype Data M: Finite Mixture Likelihood SPLINK, ASPEX
Joint distribution of Pedigree IBD • IBD of relative pairs are independent e.g If IBD(1,2) = 2 and IBD (1,3) = 2 then IBD(2,3) = 2 • Inheritance vector gives joint IBD distribution Each element indicates whether paternally inherited allele is transmitted (1) or maternally inherited allele is transmitted (0) Vector of 2N elements (N = # of non-founders)
Pedigree allele-sharing methods • Problem • APM: Affected family members Uses IBS • ERPA: Extended Relative Pairs Analysis Dodgy statistic • Genehunter NPL: Non-Parametric Linkage Conservative • Genehunter-PLUS: Likelihood (“tilting”) • All these methods consider affected members only
Convergence of parametric and non-parametric methods • Curtis and Sham (1995) MFLINK: Treats penetrance as parameter Terwilliger et al (2000) Complex recombination fractions Parameters with no simple biological interpretation
Quantitative Sib Pair Linkage X, Y standardised to mean 0, variance 1 r = sib correlation VA = additive QTL variance Haseman-Elston Regression (1972) (X-Y)2 = 2(1-r) – 2VA(-0.5) + Haseman-Elston Revisited (2000) XY = r + VA(-0.5) +
Improved Haseman-Elston • Sham and Purcell (2001) • Use as dependent variable Gives equivalent power to variance components model for sib pair data
Variance components linkage • Models trait values of pedigree members jointly • Assumes multivariate normality conditional on IBD • Covariance between relative pairs = Vr + VA [-E()] Where V = trait variance r = correlation (depends on relationship) VA= QTL additive variance E() = expected proportion IBD
QTL linkage model for sib-pair data 1 [0 / 0.5 / 1] N S Q Q S N n s q q s n PT1 PT2
Incomplete Marker Information • IBD sharing cannot be deduced from marker genotypes with certainty • Obtain probabilities of all possible IBD values Finite mixture likelihood Pi-hat likelihood
QTL linkage model for sib-pair data 1 N S Q Q S N n s q q s n PT1 PT2
Conditioning on Trait Values Usual test Conditional test Zi = IBD probability estimated from marker genotypes Pi = IBD probability given relationship
QTL linkage: some problems • Sensitivity to marker misspecification of marker allele frequencies and positions • Sensitivity to non-normality / phenotypic selection • Heavy computational demand for large pedigrees or many marker loci • Sensitivity to marker genotype and relationship errors • Low power and poor localisation for minor QTL