Download
1 / 13
210 likes | 591 Views
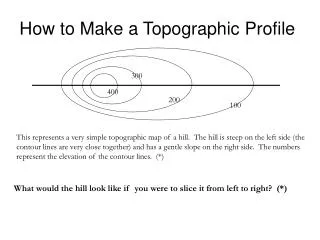
How to Make a Topographic Profile. 300. 400. 200. 100.

E N D
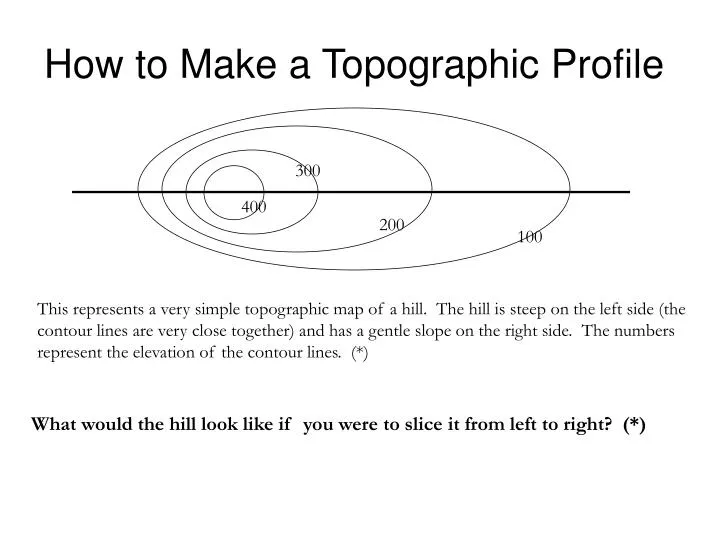
How to Make a Topographic Profile 300 400 200 100 This represents a very simple topographic map of a hill. The hill is steep on the left side (the contour lines are very close together) and has a gentle slope on the right side. The numbers represent the elevation of the contour lines. (*) What would the hill look like if you were to slice it from left to right? (*)
500 feet 400 feet 300 feet 200 feet 100 feet How to Make a Topographic Profile 300 400 200 100 Again, think of the cardboard analogy. Every layer of cardboard would represent 100 feet of elevation (the same as a contour line). You would have 4 layers of cardboard. Viewed from the side it would look like this (*) Thus, you have a somewhat blocky profile of what the hill looks like. (*) Each layer of the hill has a different piece of cardboard. To determine the size, draw lines from the hill down to the appropriate layer of cardboard. (*)
500 feet 400 feet 300 feet 200 feet 100 feet How to Make a Topographic Profile 300 400 200 100 Thus you have a topographic profile. This is what the hill would look like if you were to cut it along the profile line and look at it from the side. (*) Normally, the Earth’s surface is not this blocky. In a topographic profile a line is drawn from these points (red dots) producing a smooth transition. (*)
A B Now it’s your turn. (*) This is the profile line – from A to B. Where this black line crosses the INDEX CONTOURS (you do not have to do every contour line) draw a line down to the appropriate contour elevation (layers) below. (*)
The contour interval of this map is 40 feet. Every index contour would then be 200 feet. 8000 7800 7600 7400 7200 7000 6800 6600 6400 Find this page in your Topo Worksheet Packet
A B The contour interval of this map is 40 feet. Every index contour would then be 200 feet. 8000 7800 7600 In this region the profile line cut across the 7800 foot line 4 times. (*) 7400 7200 7000 6800 6600 6400 The profile is finished. (*) The last step is to simply connect the “dots”. (*)
A B The contour interval of this map is 40 feet. Every index contour would then be 200 feet. 8000 7800 7600 7400 7200 7000 6800 6600 6400 This is a very classic example of a butte with steep sides and a very flat top. The profile that you see here is an exaggerated scale – the vertical scale is greater than the horizontal scale. The next example is where the vertical scale is closer to the horizontal scale. (*)
A B In this example the butte is still the same horizontal distance, but the vertical scale has been compressed. If the vertical scale was bigger it would produce more exaggeration. (*) These are just different representations of the same butte. On the test, the profile that you will be asked to draw will be simpler than this one. (*)
THE GRAND CANYON, ARIZONA This view of the Grand Canyon is from the South Rim looking north into Bright Angel Canyon. This is what it looks like on a topographic map. (*)
THE GRAND CANYON, ARIZONA It may not be as majestic but it is full of information. (*) This view of the Grand Canyon is from the South Rim looking north into Bright Angel Canyon. This is what it looks like on a topographic map. (*)
Cumberland, Pennsylvania/Maryland Based on the slope information provided by the brown contour lines, the tributaries flow down fairly steep slopes (the contour lines are close together) making them YOUTHFUL streams. The main stream occupies a valley that has very few contour lines. In fact the wide spacing of these contour lines represents a floodplain – placing this river in the MATURE stage. (*) A B Try to visualize what this profile would look like before you move on. (*) Just for fun, let’s construct a topographic profile across the main stream from point A to point B. (*)
Cumberland, Pennsylvania/Maryland A B 1100 1000 900 800 700 600 Using every INDEX CONTOUR – 100 foot interval … (*) Print this page if you want to draw the profile. The next slide goes through the process. READY ? (*)
Cumberland, Pennsylvania/Maryland A B 1100 1000 900 800 700 600 Using every INDEX CONTOUR – 100 foot interval … (*) Stream Now just connect the dots and draw a smooth profile. The stream occupies the lowest point of the valley. (*)