Download
1 / 52
520 likes | 612 Views
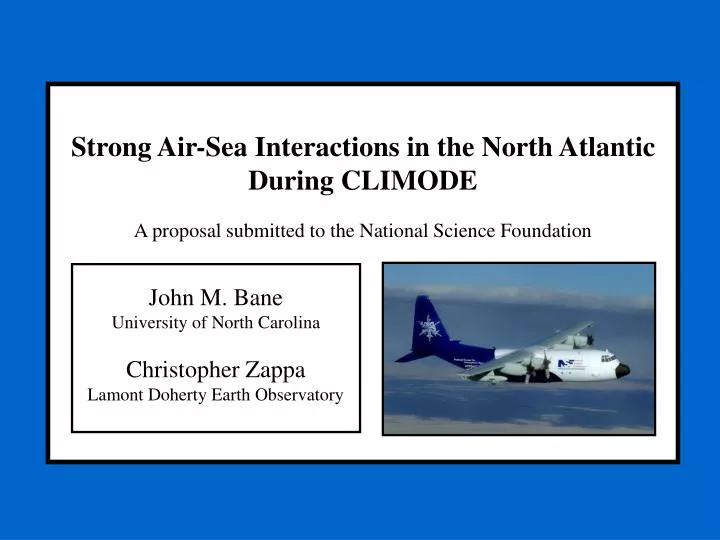
Strong Air-Sea Interactions in the North Atlantic During CLIMODE A proposal submitted to the National Science Foundation. John M. Bane University of North Carolina Christopher Zappa Lamont Doherty Earth Observatory. ATMOSPHERIC SURFACE PRESSURE Height of 1000 mb surface (m)

E N D
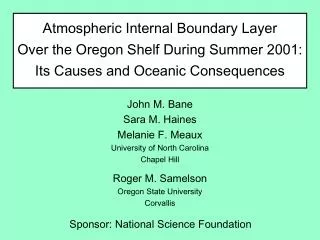
Strong Air-Sea Interactions in the North Atlantic During CLIMODEA proposal submitted to the National Science Foundation John M. BaneUniversity of North CarolinaChristopher ZappaLamont Doherty Earth Observatory
ATMOSPHERIC SURFACE PRESSURE Height of 1000 mb surface (m) Average: May-August 2001 L COAST H L
LINE 1 3 5 7 NEWPORT WIND JET HECETA BANK LINE 2 4 6 8
THERMOCLINE VARIATIONS THROUGHOUT COAST REGION
SURFACE CURRENTS Radar data courtesy M. Kosro
Strong Air-Sea Interactions in the North Atlantic During CLIMODEA proposal submitted to the National Science Foundation John M. BaneUniversity of North CarolinaChristopher ZappaLamont Doherty Earth Observatory
C-130 Flight Program Mid-Feb to Late-Mar From Bermuda Several cold air outbreaks MABL structure Surface heat, moisture, momentum fluxes Upper-ocean temperature (AXBTs) SST fine structure (SST Imager) • FLIGHT AREA CAN BE SHIFTED • Weather conditions • Find highest flux region • Ship overflight • Buoy overflight
NDBC 44004 C-130 Flight Program Mid-Feb to Late-Mar From Bermuda Several cold air outbreaks MABL structure Surface heat, moisture, momentum fluxes Upper-ocean temperature (AXBTs) SST fine structure (SST Imager)
NDBC 44004 Jan-Feb-Mar 1994 Atmospheric Pressure Air Temperature ********** 20 Cold Air Outbreaks Air Temp < 10 oC, Wind Speed > 6 m/s, Wind Dir 115-205 oT
NDBC 44004 Jan-Feb-Mar 1994 Atmospheric Pressure Air Temperature Water Temperature
CAO Sections during GALE (1986) WIND 8-10 m/s
Temperature Inversion In-situ atmospheric and oceanic temperature
Approx. Top of MABL Temperature Inversion Vertical profiles of latent and sensible heat fluxes
WIND SUFR. CURRENT Video image, TIR image, and spectra of the TIR image showing coherent ramp structures in the upper ocean. The lack of coherent parallel features in the video imagery suggests that the ocean surface features observed in the TIR imagery are not related to surface gravity waves. Here, the skewness of the temperature variability is 2.8, strongly suggestive of “billows” from shear-induced overturning.
Questions • How do MABL structure and surface flux fields during CAOs in CLIMODE compare with other, previously measured WBCs? • What are the small-scale features in the SST field and how do they relate to air-sea exchange processes? • Why is this the region of annual-maximum heat flux? Are the CAOs stronger here or more frequent? • Is there a local heat balance in the upper ocean? • How well do aircraft-, buoy- and ship-measured surface fluxes compare with each other and with satellite estimates? • Can front-parallel wind stresses be related to cold surface advection across the Gulf Stream SST front?
Questions • How do MABL structure and surface flux fields during CAOs in CLIMODE compare with other, previously measured WBCs? • What are the small-scale features in the SST field and how do they relate to air-sea exchange processes? • Why is this the region of annual-maximum heat flux? Are the CAOs stronger here or more frequent? • Is there a local heat balance in the upper ocean? • How well do aircraft-, buoy- and ship-measured surface fluxes compare with each other and with satellite estimates? • Can front-parallel wind stresses be related to cold surface advection across the Gulf Stream SST front?
Questions • How do MABL structure and surface flux fields during CAOs in CLIMODE compare with other, previously measured WBCs? • What are the small-scale features in the SST field and how do they relate to air-sea exchange processes? • Why is this the region of annual-maximum heat flux? Are the CAOs stronger here or more frequent? • Is there a local heat balance in the upper ocean? • How well do aircraft-, buoy- and ship-measured surface fluxes compare with each other and with satellite estimates? • Can front-parallel wind stresses be related to cold surface advection across the Gulf Stream SST front?
Questions • How do MABL structure and surface flux fields during CAOs in CLIMODE compare with other, previously measured WBCs? • What are the small-scale features in the SST field and how do they relate to air-sea exchange processes? • Why is this the region of annual-maximum heat flux? Are the CAOs stronger here or more frequent? • Is there a local heat balance in the upper ocean? • How well do aircraft-, buoy- and ship-measured surface fluxes compare with each other and with satellite estimates? • Can front-parallel wind stresses be related to cold surface advection across the Gulf Stream SST front?