Download
1 / 47
470 likes | 547 Views
Fort Stanwix National Monument Energy Audit. Detailed Design Review Friday, February 13 th , 2009 Customer: FSNM, contact: Debbie Conway Guide: Brian Thorn P09453. Project Description. Customer Needs. Rational for Customer Needs based on: Project readiness packet

E N D
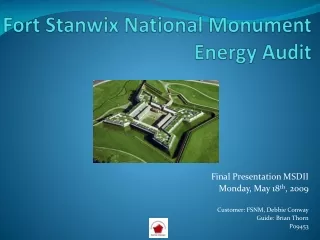
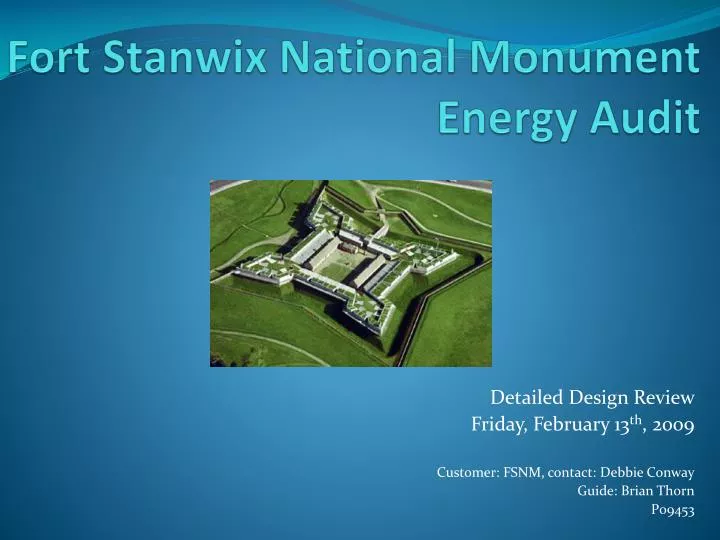
Fort Stanwix National Monument Energy Audit Detailed Design Review Friday, February 13th, 2009 Customer: FSNM, contact: Debbie Conway Guide: Brian Thorn P09453
Customer Needs • Rational for Customer Needs based on: • Project readiness packet • December 2nd phone interview with FSNM – Debbie Conway • December 13th onsite visit with Debbie and Todd • Key statement: reduce current total cost of energy at FSNM to offset the impact of potential ‘green’ energy opportunities and conservation measures
Project Specs – Expectations • Project Specifications: • Attempted traditional approach, it was not inline with an energy audit, not a product • Defined specifications in terms of an energy audit • Project specificationsare the agreed upon expectations of the total energy assessment process and outcome – ‘What is included and captured’ • FSNM specifications are expectations regarding the explicit actions, information, analyses and results that the entire energy assessment project will contain • Definition of the content in the final assessment report • Current Specification is posted on EDGE for review • Debbie Conway singed contract on 1/26/09
Energy Assessment Approach Sections to be covered: • Utility Bill Analysis • Electricity costs & profile, baseline values • Gas costs & profile, baseline values • Energy Use Index & Building Load Factors • Building Envelope & Operations • Heat transfer across envelope • Occupancy distribution • Onsite Visit Details • 1st Visit • 2nd Visit
Utility Analysis – Electricity • NYS Commercial Average price per kWh in cents • Energy Information Administration: • Willett Center charged less than average commercial in NYS Energy consumption graphs available on EDGE
Utility Analysis - Gas • National Propane Gas Association: • Willett Center charged less than average • Cost is $12.18 • 1 Mbtu = 10 therms Energy consumption graphs available on EDGE
Utility Analysis – EUI & Loads Load Factors – gives ratio of average demand to peak demand: indicates a savings if some electric loads are shifted to off-peak hours - Max is 1.0 if no variation in consumption or time of day peaks in demand
Building Envelope Analysis • Determines energy loss through windows, doors and walls based on: • average outside temp, inside temp, insulation, sq ft Window info collected from Todd Gerrard via email
FSNM Visitor Distribution • - Nearly normal distribution • Assuming sign-in distribution of visitors parallels aggregate trend • Open 362 day/year: 9 am – 5 pm
Onsite Visit • 1st site visit, Saturday 12/13 • Refined customer needs, tour, pictures and data collection • Analyze building envelope, ECM potentials • 2nd site visit, Friday 1/23 • Gave project update, refined renewable demo portion • Counted & documented all lights & energy consuming devices (ECDs) • Took building measurement not clear on floor plan • Captured IR images with camera on loan from Dr. Joe Pow • Goal: uncover hidden energy loss
IR Camera images • Gathered interior & exterior pictures, • Outcome: discovered points of interest, but nothing significant • All IR photos available on EDGE: https://edge.rit.edu/content/P09453/public/Willett%20Center%20Infrared%20Pictures Notice how cold exterior windows are in the shade (exterior ~30 F)
Energy Consumption Devices • Any device that consumes electricity • Lighting & HVAC equipment not counted • Total: 106 items used at Willett Center • Wide range of items, most drawing electricity for 8+ hrs/day • Applied toward model & straight energy savings approach Found only 1 energy star product, looking into cost/benefit of going to all energy star
Current Mechanical Systems • HVAC system (additional equipment list available): • 2 Roof Top Units (RTUs) used for solely cooling • RTU1 – runs all year for collections/storage as needed • Innovent Unit: 9000 CFM with mixing box & humidifier • NORTEC Humidifier – electric, collections & storage, erratic humid levels shown by data logger • RTU2 – supplies variable air volumes in exhibit area • Trane Unit: 9200 CFM with variable frequency drive • VFD controls static pressure in air ductwork • 2 Exhaust fans, 1 – restroom & locker rooms, 1 – boilers • Run at 1250 and 400 CFM respectively • It was noted that exhaust fan 1 runs a large portion of the day
Current Mechanical Systems • HVAC system (additional equipment list available): • Boilers – hot water heating system: • 2 Fulton boilers, 300,000 BTUh, always on, varying water temp • Runtime over last 1.5 years: • Boiler-1 2358.0 hrs • Boiler-2 2058.6 hrs • Total hours & cycles: • Boiler 1 8971 hrs, Total Cycles - 58391 • Boiler 2 9509 hrs, Total Cycles – 49035 • Info provided by Todd Gerrard • Plan: investigate newer software versions, 3rd party system wide control systems
Mechanical Systems Controller • Trane Tracer System – control/monitors: • Boilers, Pumps, humidifier, RTU1 & 2 Fans, variable air volume • Controlled from computer terminal on-site • Tracer Summitt Base, Version 17.00 Rev 2, PN: 40201111-V17 • 2 class software – monitor only, monitor/control • Todd Noted: • RTU 1 & 2 are ’self’ controlled including humidifier, setting can not be adjusted by Trane Tracer system • Exhaust fans independent of control system • Control systems ’fight’ each other
Lighting System • The buildings use a range of different bulbs for different purposes. • Most rooms in Willett Center have occupancy sensors. • Documented all lights in Willett Center • Determined wattage • Computed annual kWh consumed
Software Modeling – eQuest • Initially – attempted to purchase expensive, comprehensive software • Distributor did not sell within United States • Alternatives to complex • Contacted Energy Assessment firm for recommendation • eQuest – tool from department of energy • Free • More User friendly interface, decreases learning curve • Fully function building model
eQuest Benefits • Enables ‘What-if’ analyses through implementing ECMs and analyzing effects • Lifecycle cost analysis • Allows different ESCO rates & billing structures • With actual weather and utility data • Base model input using CAD drawing, apply zones in eQuest • Orient building accurately
eQuest Building Creation Wizard • The opening Design Development Wizard: • Project/Site/Utility • Edit Building Shell • Edit Air-Side System • HW Plant Equipment • Build up utilizing these options
eQuest Building Creation Wizard • Design Development Wizard: • Walls, ceilings, doors • Insulation values • Occupancy, loads • HAVC & lighting • Non-HVAC • ECD, pumps • Domestic Hot Water • Temp & air flow settings • Schedule of HVAC & non-HVAC systems • Energy Efficiency • Insulation
eQuest Simulated Performance • Equipped to handle multiple ECMs and a baseline
Latest Model • Electricity and Gas consumption are within 10 % of actual building performance • Next step: move into testing impacts off different adjustments to building
Energy Conservation and Savings Measures and Opportunities • Developed from on site assessment, observation, and calculations and software modeling • Short term: operation & maintenance approach, low cost replacements and or upgrades • Long term: retrofit through replacement, upgrade systems
Implementation Plan • Aspects to include in implementation plan • Cost of new equipment, software, etc, if applicable • Return on investment (ROI) & payback • Timing • Economic Analysis of each ECM, sustainable/green option [Spring Qtr]
ESCO Analysis • Purpose: • review current energy billing structure • Investigate alternative ESCOs • Not able to switch distributor - National Grid • Structure: • Determine all possible energy providers: 9 available • Graded based on survey ranking importance from customer feedback • Goal: • Identify savings/costs of switching ESCOs
Rubric Grading – process behind subjective analysis 1) Three areas were used in the rubric to compare each ESCO to the Willett Center’s current contract with National Grid: • Billing structure • Contract terms • Energy conservation offerings 2) National Grid’s current contract was used as the benchmark for the rubric grading – being assigned an overall score of 5 (therefore an ESCO with a score less than 5 is a worse and greater than 5 a better alternative) Each area was then assigned a weighting according to the importance to the customer: • Billing structure – 52% • Contract terms – 15% • Energy conservation offerings – 33% Each area was then evaluated on a scale of 1-10, with sub-areas determining the subtraction or addition of point. Copy of grading rubric
ESCO Analysis • NIMO – baseline score of 5 • Value > than 5: Relatively better than NIMO • Value > than 5: Relatively worse than NIMO Quantitative analysis: • Purely numerical • Data from months of high-usage used from baseline • Gas and Electric comparison using quoted rates • Second pass will include the additional costs of green options
ESCO Analysis – Electric Savings • For alternative ESCO, assumed for current average variable or fixed rate (factored past data change in energy prices)
ESCO Analysis – Gas Savings • Used current alternative ESCO to compare to past data (factored past data change in energy prices)
Renewable Demo Project • Structure of demo based on customer feedback: • Demo description/setup in Willett Center for visitors • Construct with potential full scale implementation in mind • Collect data for full scale justification • Renewable Energy Demos Considered: • Wind: not conducive to full scale implementation • Solar: previously considered, most viable option • Geothermal: difficult for demo & full scale • Bio-fuel: proximity to bio-fuel stations • Solar Energy selected
Renewable Demo Layout • AC System, non-grid tied powering a load • Load to be determined
Location of System • Digging restrictions on site at FSNM, no pole mount • Roof mounted PV System Willet Center South End
Components • Spoke with Scott Williams of Solar electrics supply: • Quoted Remote Area PV system including: • 100 W Solar PV Array, conduit wiring harness, 25’ output • 2 Solar Array Roof Mounting Structure, SS hardware • MX-69 charge controller (24 to 12 V), 128 day data log • Terminal strip with fusing install inside battery control enclosure • Outdoor batter/control enclosure, vented, lockable, insulated • 150 W inverter installed inside enclosure • Sealed gel cell battery bank 12V 210 AH, maintenance free • System wiring harness, electrical schematics
Renewable Energy Costs • Scott Williams quote (with freight to ROC): $3300 • Ways to reduce this cost – ‘tone’ down the system • Fair price for caliber of system • Real-Time data logger system, as quoted by Lynn Lindsay of Solar Energy Technologies, cost $900 along • More comprehensive then solar supply, but charge controller must be bought separately • Currently , pursuing other vendor quotes, Solar Electronics Supply quote is fairly indicative of costs Quotes available via email, if needed
Renewable Demo Process Planning • Location (facing South) • Closest opening for wiring (conduit) • Outdoor location for box • Locate ground? • Indoor location • Lighting support? • Wire to other light • Wire a flip switch • Getting the panels to the roof • Pulley system?
Installation Process • Interpret electrical schematics • Pull wires through conduit • Get panels and equipment to the roof • Install Panel Mounts • Slide panels in • Set enclosure where desired • Install interior equipment • Determine order in which equipment will be safely plugged in
Equipment needed • Ammeter • Screwdrivers • Wire strippers • Wire cutters • Cardboard (large piece) • Rubber gloves?
PV Large Scale • PON 1050 – Installation of PV by eligible installers • Government buildings • $5000/kW (0 – 25kW), $4000/kW (25kW – 50kW) • System does not have to face South (calculate losses) • Grid connected vs. Battery • ROI (20 years?) • 10 Watts/ft2
Baseline Assessment • Simulation program • Based on DOE-2 free software • LEED • Volunteer government program • Point-based assessment • Self assessment possible • Determine ECMs based on it?
Moving Forward - Spring Quarter • Order Solar System Wk 11 [Winter Quarter] • Determine energy savings per ECM with detailed breakdown • Economic Analysis • Energy Assessment Report • Install Solar System • Installation, maintenance, test plan
Risks • Difficulty of solar system installation • Lead time on Solar system parts • Detailed ECM impacts • eQuest model assumptions • Funding • Proximity to FSNM
References • http://www.eia.doe.gov/cneaf/electricity/epm/table5_6_a.html • http://www.unitconversion.org/energy/therms-to-btus-th-conversion.html • http://www.npga.org/i4a/pages/index.cfm?pageid=914