Download
1 / 33
330 likes | 478 Views
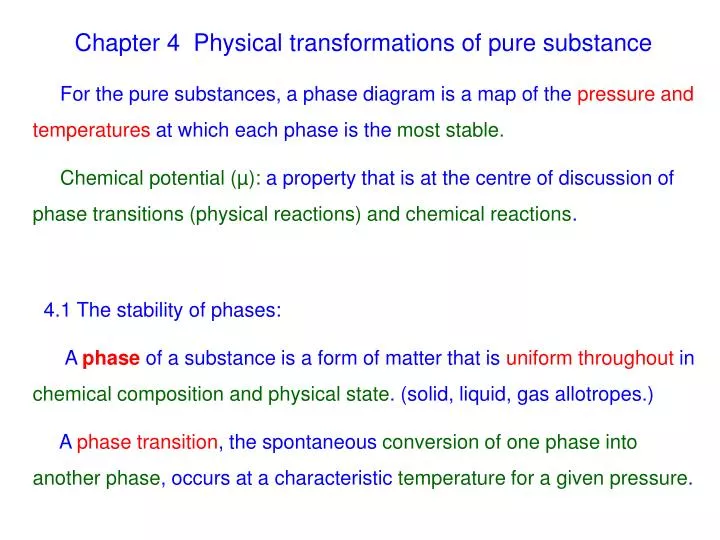
Chapter 4 Physical transformations of pure substance For the pure substances, a phase diagram is a map of the pressure and temperatures at which each phase is the most stable.

E N D
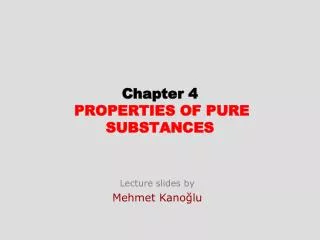
Chapter 4 Physical transformations of pure substance For the pure substances, a phase diagram is a map of the pressure and temperatures at which each phase is the most stable. Chemical potential (µ): a property that is at the centre of discussion of phase transitions (physical reactions) and chemical reactions. 4.1 The stability of phases: A phase of a substance is a form of matter that is uniform throughout in chemical composition and physical state. (solid, liquid, gas allotropes.) A phase transition, the spontaneous conversion of one phase into another phase, occurs at a characteristic temperature for a given pressure.
The transition temperature, Ttrs, is the temperature at which the two phase are in equilibrium and Gibbs energy is minimized at the prevailing pressure. A transition that is predicted from thermodynamics to be spontaneous may occur too slowly to be significant in practice. Exp. C(Diamond) C (graphite) is too slow to be detected under ambient condition. Thermodynamically unstable phase that persist because the transition is kinetically hindered are called metastable phase.
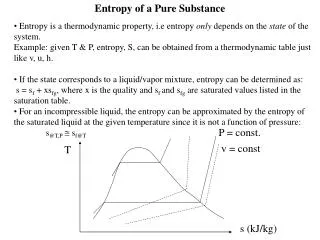
4.2 Phase boundaries The lines separating the regions, which are called phase boundaries, shows the values of p and T at which two phases coexist in equilibrium. Vapor pressure: the pressure of a vapor in equilibrium with the liquid.
Sublimation vapor pressure: the vapor pressure of the solid phase. The vapor pressure of a substance increaseswith the increase of temperaturebecause at higher temperature the Boltzmann distribution populates more heavily the sates of higher energy . (a). Critical points and boiling points When liquid is heated in an open vessel, at the temperature at which its vapor pressure would be equal to the external pressure, vaporization can occur throughout the bulk of the liquid. The condition of free vaporization throughout the liquid is called boiling. Boiling Temperature: the temperature at which the vapor pressure of a liquid is equal to the external pressure. At 1.0 atm: normal boiling point, Tb; At 1.0 bar, standard boiling point.
Boiling does not occur when a liquid in a closed vessel. Instead, the vapor pressure, and the density of the vapor rise continuously as increase of temperature. The temperature at which the surface disappears is the critical temperature, Tc. The vapor pressure at the critical temperature is called the critical pressure, pc. At and above the Tc, a single uniform phase called a supercritical fluid fills the container and interface no longer exist. At T > Tc, no liquid phase. The Tc is the upper limit for liquid.
(b). Melting point and triple points Melting point: the temperature at which, under a specified pressure, the liquid and solid phases coexist in equilibrium. (Freezing point; liquid solid) At p = 1 atm, normal freezing (melting) point, Tf At p = 1 bar, standard freezing (melting) point. Triple point (T3): a point three phase boundaries meet. (three phases coexist in equilibrium) T3 occurs at a single definite p and T characteristic of the substance. thermodynamic temperature scale The T3 marks the lowest pressure at which a liquid phase of a substance can exist.
4.3 Three typical phase diagrams • Water • The solid-liquid boundary has a • negative slope, which means a • decrease of volume on melting. • (dp/dT) < 0 At high pressures, different structure forms of ice come into stability as the hydrogen bonds between H2O modified by pressure.
Hydrogen-bonding structure in ice and water: Ice (d = 0.9 cm3/g) Water (d = 1.0 cm3/g) The volume decreases on melting. (ΔVm < 0)
(b) Carbon dioxide: The positive slope of the solid-liquid boundary. (dp/dT >0) The volume increases on melting. The triple point lies above 1 atm. To obtain the liquid, it is necessary to exert a pressure > 5.11 atm. When a 67 atm CO2 squirts(噴出) to 1 atm, only the snow-like solid CO2 was obtained
(c). Helium He behaves unusually at low temperature. The solid and gas phase are never in equilibrium however low the temperature. Solid helium can be obtained by applying pressure (Helium is too light). 4He (I = 0), has a liquid-liquid phase transition at its -line. Helium-I phase behaves like a normal liquid, Helium-II is a superfluid (no viscosity).
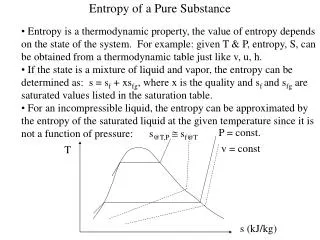
Phase Stability and Phase Transitions 4.4 The thermodynamic criterion of equilibrium Chemical potential µ = Gm, µ is a measure of potential that a substance for bring about physical or chemical change in a system. The 2rd Law: At equilibrium, the chemical potential of a substance is the same throughout a sample, regardless of how many phases are present. In equilibrium, µ(phase I) = µ(phase II) Phase II Phase I
4.5 The dependence of stability on the conditions dG = VdP – SdT ; dµ = VmdP – SmdT (a). Temperature dependence of phase stability (µ/T)p = – Sm As the temperature raises, the chemical potential of a pure substance decreases: Sm > 0 for all substance. Sm(g) > Sm(l) > Sm(s) The easiest way of bring about a phase transition is by changing the temperature.
dG = dH – TdS – SdT = dU + pdV + Vdp – TdS – SdT = dq – pdV + pdV + VdP – TdS – SdT = TdS + Vdp – TdS – SdT = VdP – SdT (b). The response of melting to applied pressure For most substances except H2O, it is as thought the pressure is preventing the formation of the less dense liquid phase. (µ/p)T = Vm An increase in pressure increases the chemical potential of any substance because Vm > 0. In general, Vm(g) > Vm (l) > Vm (s)
The pressure dependence of the chemical potential (dG = VdP ) (a). Vm(l) > Vm(s) (b). Vm(l) < Vm(s) p Tf p Tf
(c). The effect of applied pressure on vapor pressure When pressure is applied to a condensed phase, its vapor pressure rises: in effect, molecules are squeezed out (壓出) the phase and escape as a gas. Pressure can be exerted on the condense phases mechanically or by subjecting it to the applied gas of an inert gas (partial pressure). p = p*exp(VmΔp/RT) Δp: the applied pressure If VmΔp/RT << 1, p p*(1 + VmΔP/RT) (p – p*)/ p* = VmΔp/RT
Justification 4.1: In equilibrium µ(l) = µ(g) dµ(l) = dµ(g) dµ(l) = Vm(l)dP (applied pressure) ; dµ(g) = Vm(g)dp (p: vapor pressure) The gas phase behaves as an ideal gas, dµ(g) = (RT/p)dp RT/pdp = Vm(l) dP RT (1/p)dp (p* p) = Vm(l) dP (p* ΔP + p*) If Vm(l) = constant, and vapor pressure change (p – p*) << ΔP RT ln (p/p*) = Vm(l) ΔP Illustration 4.1: For water, the molar volume = 18.1 cm3mol-1, when subjected to an increase in pressure of 10 bar, the vapor pressure has an increase of 0.73 %.
4.6 The location of phase boundary Phase boundaries – the pressure and temperature at which two phases are in equilibrium. µ(p, T) = µ(p, T) • The slope of phase boundaries • Phase boundaries dp/dT • On the phase boundaries, the two phase • continue to be in equilibrium. • dµ = dµ • For each pashe, dµ = – SmdT + Vmdp • – S,m dT + VmdP = –S,m dT + V,m dp • (V,m– V,m)dp = (S,m– S,m)dT • dp/dT = ΔtrsS/ΔtrsV
(b). The solid-liquid boundary: dp/dT = ΔfusH/TΔfusV (ΔfusS = ΔfusH/T) ΔfusV: the change in molar volume on melting ΔfusV is usually positive and always small. dp = (ΔfusH/ΔfusV) 1/T dT p p* + ΔfusH/ΔfusV ln (T/T*) When T is close to T* (ln T/T* = ln(1+ (T –T*)/T*) (T – T*)/T* p p* + ΔfusH/T*ΔfusV (T –T*)
(c). The liquid-vapor boundary: dp/dT = ΔvapH/TΔvapV (ΔvapH > 0 ; ΔvapV > 0 and large) dp/dT > 0 for vaporization, and hence the boiling temperature is more responsive to pressure than the freezing temperature. Cooking in a covered pot, Pressure boiling temperature cooking rate Because the molar volume of a gas is larger than that of a liquid. dp/dT = ΔvapH/T(RT/p) dlnp/dT = ΔvapH/RT2 (Clausius-Clapeyron eq.) p = p*ex x = ΔvapH/R (1/T – 1/T*)
(d) The solid-vapor boundaries dp/dT = ΔsubH/TΔsubV dp/dT = ΔsubH/T(RT/p) dlnp/dT = ΔsubH/RT2 p = p*ex x = ΔsubH/R (1/T – 1/T*) Due to the ΔsubH > ΔvapH The dp/dT slope for sublimation curve is steeper than that for vaporization curve at similar temperature.
4.7 The Ehrenfest Classification of Phase Transitions: Other transitions: Solid-solid, conducting-superconducting and fluid-superfluid. At the transition from a phase to another phase : (µ/p)T – (µ/P)T = V,m – V,m = trsV (µ/T)p – (µ/T)p = –S,m + S, m = trsS = trsH/Ttrs The first derivatives of the chemical potentials with respect to pressure and temperature are discontinuous at transition. A transition for which the first derivative of the chemical potential with respect to temperature is discontinuous is classified as a first-order phase transition.
4.7 The Ehrenfest Classification of Phase Transitions: 1st 2rd
A second-order phase transition in the Ehrenfest sense is one in which the first derivation of with respect to temperature is continuous but its second derivative is discontinuous. V, H, and S do not change at the transition. The Cp is discontinuous at transition but does not become infinite there. A conducting-superconducting transition in metals at low temperature is an example of second-order transition.
The term -transition is applied to a phase transition that is not first order yet the heat capacity becomes infinites at the transition temperature. This type of transition includes order-disorder transitions in alloys, the onset ferromagnetism, and the fluid-superfluid transition of liquid helium.
Second-order phase transition and -transitions: Suppose the two shorter dimensions increases more than the longer dimension when the temperature is raised. The tetragonal cubic phase transition has occurs, but as it has not involved a discontinuity in the interaction energy between atoms or the volume they occupy, the transition is not first-order.
The order-disorder transition in -brass (CuZn) is an example of a -transition. At T =0 the order is perfect, but islands of disorder appear as the temperature is raised. The islands form because the transition is cooperative in the sense that, once two atoms have exchanged locations, it is easier for their neighbors to exchange their location. The island grow in extent, and merge throughout the crystal at the transition temperature (724 K).
5.1 Inorganic Solid-State Clathrate Compounds 5.1.1 Clathrate Hydrates: 5.1.1.1 Formation: Many relatively nonpolar compounds that do not hydrogen bonding with water are capable of forming clathrate hydrates. In contrast, species such as alcohols, acids and ammonia, which are capable of forming hydrogen bonds, do not generally form hydrates. Solid clathrate hydrate are formed under very specific temperature (often well above the melting point of pure ice) and pressure. Indeed, some known gas hydrate are stable to 31.5 oC.
This high degree of thermal stability is currently a significant problem in the natural gas industry. Transport of natural gas (CH4) in pipeline is plagued by blockages caused by the formation of clathrate hydrates. Solutions: 1. Drying and warming the gas. 2. Addition of large quantities of kinetic (PVP; polyvinylpyrrolidinone) and thermodynamic (methanol, glycol, salt solutions) hydrate formation inhibitors. 5.1.1.2 Structure: Ice does not possess any cavities capable of including guest molecules. Hydrates: a template reaction occurs in which polyhedral cavities are form according to guest size.
The cavities are composed extensively of fused five- and six-membered hydrogen-bonded rings. 512(5: five-member ring, 12: the number of ring in the cage)
Almost all clathrate hydrates form two basic structure termed type I and type II.
Type II clathrate hydrates Type I clathrate hydrates Guest molecule
In general, small guests occupy the small 512 type cavities. The small difference between the size of this cavity in structures I and II can have a significant effect on which structural type is adopted. He, H2 and Ne are small enough to diffuse through the cage and do not form hydrates. In the real hydrates, some cages remain empty. Thus the real hydrates have more water than the “ideal composition”.