Download

1 / 36
370 likes | 477 Views
Data analysis, management and writing up. Documenting data (1): Taking notes. Make notes ideally during the interview/focus group. If this is not possible, record the findings as soon after as possible.

E N D
Documenting data (1): Taking notes • Make notes ideally during the interview/focus group. If this is not possible, record the findings as soon after as possible. • Note taking has the added advantage of showing respondents you are interested in what they have to say. • If possible have a dedicated note taker during discussions, so one interviewer can focus on interactions, the other on taking notes.
Documenting data (2): Record and transcribe • Interviews or focus groups can also be digitally recorded and later transcribed word for word. • Why record? • Recording can offer word to word back up of testimonies. Excellent if ‘quotes’ are required. • The interviewer can focus on listening. Eye contact etc. • Drawbacks of recording: • Expensive and time consuming • Can cause discomfort • People may not want to divulge information which is re-playable. • Ethics: Always ask first and be sure the participant is willing to be recorded. Offer respondents the opportunity to switch off recording device.
Sample transcript Note date, time and place Note non verbal signs (expressions, mood, actions) Note who says what if there are more than 1 interviewer/ interviewee, if possible, also note gender and age?
Coding data (1) • Once you have reviewed your field notes and interview transcripts the next stage is to organise your data and begin analysis. • ‘Coding’ or categorising the data is an essential stage in data analysis. Researchers use codes to pull together and categorize a series of otherwise discrete events, statements, and observations which they identify in the data (Charmaz, 1983: 112)
Coding data (2) • Coding involves organising your data according to themes or ‘codes’. • It requires careful review of interview transcripts, field notes and even secondary data sources. • These codes will form the basis of the arguments you will make when writing up
Coding data (2): Identifying themes: There are two types of ‘code’ or theme: • A priory codes: based upon pre-set criterion • Primarily these should be based upon the research questions you are addressing • They can also be driven by current theory and literature on the topic in question or your interview guides. • Grounded codes: • These emerge directly as you review your data and are not based upon pre-set ‘prejudices’. A combination of both can be used
Identifying sub-themes • Once one have identified core codes or themes, one can search for sub-themes. • Depending upon how much data one has, sub-themes within the sub-themes can even be identified!
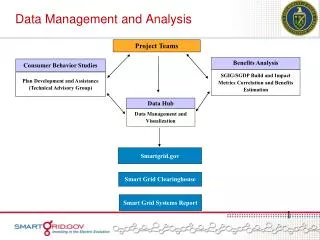
Highland aquatic resources and livelihoods Household livelihood strategies Intra-household livelihood strategies Accessing aquatic ecosystems Core themes Economic constraints to access Institutional constraints to access ‘Medium wealth’ households ‘Rich’ households Gender Age Sub-themes ‘Poor’ households Birth order A priori codes Grounded code – emerges during data analysis
Practicalities of coding the data? • Highlight selected points according to theme or sub-theme (may be time consuming and becomes unmanageable if there are many topics). Useful for rough coding in the field when you do not have access to computer. • Ideally, create a document for each theme and respective sub-theme and note down points (or paste electronically) under the respective heading.
Example of coded data Theme Sub-themes Note place, date and format e.g. Interview transcript, rough notes etc.
Searching for trends (1) • When coding, data can not always be ‘lifted’ directly from field notes of interview/focus group transcripts and organised by theme. • In order to identify valid data relevant to a particular theme, or even to identify new themes, deeper analysis is necessary. • Try to reorganise your raw data to search for trends • Once identified, the arguments can be noted in the main data set
A useful process for identifying trends relating to gender/age data • Create an additional data set from your raw interview transcripts/notes, whereby all the men’s responses are grouped together in a section, followed by all the women’s, then all the boys’ and finally all the children’s responses. • Look at each document • Did what the men say in relation to a particular question differ from what the women said? Did what the adults say, differ from what the young people said? • If there are differences, how may these be explained? What similarities occurred across gender/age categories? • Is gender and/or generation really important or are other factors more important such as type of occupation and location? • A summary should be written which brings together the main points raised in each file.
Data sharing • All data should be shared online on the HighArcs website wiki system: http://www.higharcs.org/forum • Regularly upload both ‘raw’ data files and ‘coded’ data • Include the date in the filename for each new set of data and indicate whether it has been coded or not : • e.g. Vietnam_Uncoded_focusgroup_data_12/05/09
1 Login
2 • highArcs*2010 Select ‘Field Reports’, then when requested enter password. Note: Sometimes, this icon is not displayed as the website does not recognise you are logged in. After you login click on the "Search" link on the upper right side of the page. You will notice that on the upper part of the page there is a message saying "Welcome back, (username) ..." that means that it has detected that you have logged in. Return to the main page by clicking on the "HighArcs Forum" link on the upper left side of the page.
3 Select country
4 Select ‘New thread’
5 Select ‘New Attachment’, then attach as in an email
Writing up (1) • Triangulation • Can you cross-check your finding from one source with another source? • E.g. Did a review of statistical data back up qualitative testimonies from respondents • Be clear about data sources where possible. Was the argument from a focus group or interview? Did you read it in a secondary dataset..? • Representativeness • How typical is the evidence you are presenting? • Quantifying data is not always possible or desirable, but do try to give an indication of how many of your participants held this particular view
For example: • E.g. “A small number of fishermen even thought that the availability of micro-credit facilities were what caused them to fall into debt” • ...rather than “the availability of microfinance had caused increased indebtedness.” • Another example: “in a focus group discussion, half of the women stated that they were not happy with the microfinance facilities, while all the men were satisfied with the service.”
Writing up (2) How will you present the data? • Case studies: Effectively brings the data to life– Allows respondents to present their perspectives, meanings and voices. • ‘Thick description’: built up from your observations and field notes, often rewritten by putting together different parts of your notes. • Quotations: • May present a long one, or several short ones • Choose quotes that are typical (not just those from your favourite key informant because they are so articulate – make sure choice of quotations comes from across the data set). • Ethics: Avoid tidying up’ quotations or choosing untypical ones because they fit your argument; Maintain confidentiality and anonymity; Informed consent = to publish quotations and photos.
Making sense of qualitative data 1) What do you think this extract is about? 2) What themes emerge from this data? 3) How would you ‘read’ and interpret this data?
1) Literal reading WORK: • unpaid household work versus paid work • ways children can start to earn money for themselves • depend on opportunities and constraints
2) Emerging themes Work: • Active contribution to household • Positive • sense of satisfaction and pride • balance household responsibilities & individual needs • negotiation
bargaining power • sibling support • gender dimension = children’s strategies for income generation
3) What does this mean? Household relations are interdependent and negotiable • Inter-generationally: children & parents • Intra-generationally: between siblings • Not fixed and change over time
Comparison of unpaid rural work and paid urban work • gendered division of labour • birth order and sibling rivalry • labour-intensive nature of farming • migrant work opportunities
Data sources • General fieldnotes • households • individuals • within the community • on the local bus • School observation notes • classroom and playtime observations • informal interviews: pupils and teachers • school documents • Task-based materials • Semi-structured interviews
Mini case studies: Households Key children Pupil profiles Teacher profiles Key themes Home School Play Work Migration Future aspirations Changes over time Research process Sorting the data
Ongoing process of analysis • Organising and sorting the data • coding facilitates analysis • The process of ‘building explanations’ (Mason, 2002) = An inductive approach • exploratory, indepth, themes emerge • ‘Grounded theory’
‘Home' • Gender roles • Child/adult work roles in household • Power and discipline • adult power over children • children's strategies for counteracting adult power • avoidance strategies • coping strategies • negotiation strategies • child-parent negotiations • sibling negotiations
‘Reading’ data • literally, interpretively or reflexively (Mason, 2002) • Description • Explanation • comparative • linking to concepts & the wider literature • theoretical • Reflection • what are the strengths and weaknesses of the data? • which method is the evidence from?
Aim: to produce a convincing argument based on your qualitative data • forming categories • identifying relationships between them • looking for patterns, themes and trends • investigating and developing ideas
Writing up qualitative data: published example Punch, S. (2007)‘Generational Power Relations in Rural Bolivia’, in Panelli, R., Punch, S. and Robson, E. (eds) Global Perspectives on Rural Childhood and Youth: Young Rural Lives, London: Routledge, pp. 151-164.