Download

1 / 18
180 likes | 316 Views
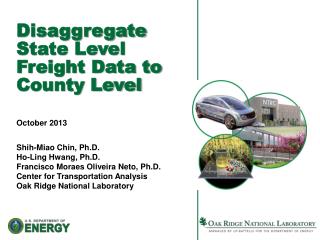
State and Local Freight Data. Using National Freight Data for Local Planning. FHWA Talking Freight Seminar. May 2010. Dike Ahanotu, Ph.D. Topics. National freight data sources – CFS, FAF, TRANSEARCH Considerations for local freight planning efforts

E N D
State and Local Freight Data Using National Freight Data for Local Planning FHWA Talking Freight Seminar May 2010 Dike Ahanotu, Ph.D.
Topics • National freight data sources – CFS, FAF, TRANSEARCH • Considerations for local freight planning efforts • NCFRP 20 – preliminary findings and next steps • Developing local freight data • Potato production example • Diesel production example
National DataBTS Commodity Flow Survey - Overview • Why focus on CFS? • Basis of FHWA FAF2 • Dominant source for short-distance truck trips in TRANSEARCH • Shipper survey of select industry sectors • Over 100,000 responses across most significant industries • Survey data expanded to 117 regions, 7 modes, and 23 commodities • Very useful for freight planning efforts
National DataBTS Commodity Flow Survey – Missing Data • Sectors included in the survey • Mining, manufacturing, wholesale trade, select retail trade industries, auxiliary establishments • Sectors not included in the survey • Farms, forestry, fishing, utilities, construction, government-owned entities, transportation, most retail and services industries, foreign-based businesses importing into the U.S. • Missing data due to • Cells with small or zero values • Proprietary concerns when a single firm dominates a particular O-D-M-C combination
National DataBTS Commodity Flow Survey – Survey Mechanism • 40 shipments requested from each shipper • Shipments reported at regular intervals (e.g., every 20th shipment) • Multistop tours recorded as single shipments from shipper to each stop along the tour
National DataBTS Commodity Flow Survey – Summary of Issues • Several sectors not included – many are local truck trips • Trip chaining not captured • Full supply chain of import flows not included • Open questions • How are firms handled that cross industries (e.g., Hewlett Packard)? • How did individual firms interpret shipment information requests? For example, did they include parcels? • How did firms respond when they had incomplete information? • How did firms respond when they had unsophisticated shipment record storage systems?
National DataFHWA Freight Analysis Framework • Key features • Built entirely from public data sources • Transforms CFS data to complete freight flow database • Log-linear modeling and IPF used to fill in “zero” cells • Employment, population, and VIUS truck VMT data used for out-of-scope CFS sectors • Biggest issues • Technique to fill in zero cells is somewhat problematic for data suppressed for proprietary reasons • No field data used to validate methods used for out-of-scope sectors • Relationships will not hold true for all localities
National DataTRANSEARCH • Privately maintained freight flow database • Off-the-shelf, county-level freight flow data available relatively quickly • Key features of methodology • Heavier reliance on economic data • Motor carrier data exchange used to distribute truck trips • CFS still heavily used for shorter distance truck trips • Biggest issues • Similar issues to CFS at local level
NCFRP 20Summary of Preliminary Findings • Several attempts to disaggregate FHWA FAF • Less frequent efforts to develop ground-up freight flow data to supplement or substitute other sources • Very few efforts to validate the relationship between socioeconomic data and freight flows • Limited data indicate that this method works better for some commodities rather than others
NCFRP 20FAF2 Disaggregation Example • Method to correlate economic data to commodity tonnage flows (production data) * SCTG 20-23 is Basic Chemicals, Pharmaceutical Products, Fertilizers, and Chemical Products and Preparations n.e.c. ** SCTG 10-15 is Monumental or Building Stone, Natural Sands, Gravel and Crushed Stone, and Nonmetallic Minerals n.e.c.
NCFRP 20Next Steps (Preliminary) • Identify freight planning applications • Develop generic supply chain descriptions • High value, high volume, highly problematic • Assess methods for compiling subnational commodity flow data in terms of • Meeting needs of freight planning applications • Filling in gaps of existing commodity flow databases • Describing important supply chains • Collect small sample of new data to validate methods • May involve analysis of existing local databases • Develop guidebook on subnational commodity flow data
Developing Local Freight Data • General methodology • Estimate value of commodity generated based on economic output data from public sources or trade associations • Convert value to tonnages using sources such as CFS • Identify mode share from state or national data or industry experts • Convert modal tonnage to vehicle data using sources such as VIUS • Two Washington examples show range of applications for this methodology
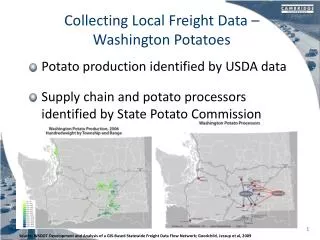
Washington Potato ExampleProduction • Potato production identified based on USDA and Washington State Potato Commission Source: WSDOT Development and Analysis of a GIS-Based Statewide Freight Data Flow Network; Goodchild, Jessup et al, 2009
Washington Potato ExampleProduction (continued) • Supply chain and potato processors identified by Washington State Potato Commission Source: WSDOT Development and Analysis of a GIS-Based Statewide Freight Data Flow Network; Goodchild, Jessup et al, 2009
Washington Potato ExampleProduction (continued) • Potato distribution identified by Commission survey • Freight flows were ultimately assigned to trucks and routed on the Washington highway network Source: WSDOT Development and Analysis of a GIS-Based Statewide Freight Data Flow Network; Goodchild, Jessup et al, 2009
Washington Diesel Supply Chain Example • Diesel distribution data held in a multitude of locations by a number of agencies and private sector companies • WA DOA – regulates quality and quantity of fuel delivered at gas stations • WA Department of Ecology – regulates active underground storage tanks, publishes vessel entry data • U.S. EPA – regulates above-ground storage tanks • WA DOR – responsible for assessing and collecting fuel taxes at terminal locations • Other agencies monitor mode-specific activity (e.g., pipeline, waterborne activity, railroads) Source: WSDOT Development and Analysis of a GIS-Based Statewide Freight Data Flow Network; Goodchild, Jessup et al, 2009
Washington Potato ExampleProduction • Data stitched together from several different sources produced a multimodal freight flow picture Source: WSDOT Development and Analysis of a GIS-Based Statewide Freight Data Flow Network; Goodchild, Jessup et al, 2009
Conclusions on Collecting Local Freight Data • Some commodities will be much easier than others • May require a mix of actual data and estimated data • For example, could have good production data, but poor distribution data • Trade associations and industry experts are critical • Likely cost-effective only for a select number of commodities or industries • Not cost-effective for developing entire commodity flow databases