Download
1 / 29
290 likes | 409 Views
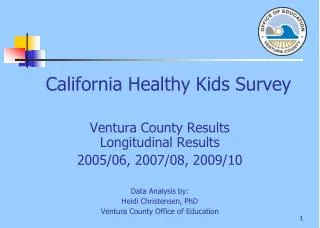
1999 California Healthy Eating and Exercise Practices Survey: Programmatic Implications for the California Children’s 5 a Day–Power Play! Campaign. Authors: Angie Keihner 1 , Tanya Garbolino 1 , Mark Hudes 2 1 Public Health Institute, 2 University of California, Berkeley.

E N D
1999 California Healthy Eating and Exercise Practices Survey: Programmatic Implications for the California Children’s 5 a Day–Power Play! Campaign Authors: Angie Keihner1, Tanya Garbolino1, Mark Hudes2 1 Public Health Institute, 2 University of California, Berkeley
Only 1% of children eat a diet consistent with federal nutrition recommendations (1989-1991 CSFII).1 Fewer than half of California children meet the 60 minute PA recommendation, and 14% get fewer than 30 minutes of PA a day.2 Diet and Exercise 1 Munoz K, et al., Food Intakes of U.S. Children and Adolescents Compared with Recommendations. Pediatrics, 1997. 100(3): p. 323 - 329. 2 California Department of Health Services, 1999 California Children's Healthy Eating and Exercise Practices Survey: Unpublished data. In press: Sacramento, CA.
In 1997, U.S. children spent $7.7 billion on foods and beverages Ranked first among expenditures Accounted for one-third of the total $23.4 billion spent Marketing to Children McNeal JU. The kids market: Myths and realities. Ithaca, NY: Paramount Market Publishing, 1999.
California Children’s Healthy Eating and Exercise Practices Survey (CalCHEEPS)
Fills a monitoring gap - no comprehensive statewide surveys on nutrition for 9-11 year-old age group Includes dietary and physical activity practices on a typical school day; knowledge, attitudes, beliefs Evaluates knowledge and awareness of 5 a Day–Power Play! Survey Purpose
Market research panel population Demographically diverse, English-speaking sample Conducted April - June 1999 Parent-assisted 2-day food and physical activity diary: Mailed, filled out, and returned Unassisted telephone survey 14 minutes, 44 questions Sample Selection and Administration
Quota sampling Demographically reflect California households with 9-11 year old children Pool of 2000 qualified households selected from the market research panel 814 returned food and activity diary 41% response rate 394 completed telephone interview 51% response rate Sampling and Response Rate
Commercial Three Wishes FV make you faster, stronger, and learn more FV give you power 5 a Day is important PSA Shaq’s Secret 5 a Day is important FV give you power Paid Advertising and Public Service Announcements (PSA) in 1999
California Children Aware of 5 a Day-Power Play! Campaign TV Spots, 1999, by Gender**, Ethnicity*, and Income* Percent of Children 48 50 40 35 31 30 24 22 21 21 20 18 20 10 0 Boys White Latino $19,999 or less $50,000 or more Girls African American Asian/Other $20,000-$49,999 * p<.05; ** p<.01 Source: California Department of Health Services, Preliminary data.
California Children Aware of 5 a Day-Power Play! Campaign TV Spots Were More Likely to Know that 5 or More Servings of Fruits and Vegetables Are Needed for Good Health, 1999 Percent of Children Aware of 5 a Day-Power Play! 60 53 Yes No/Don't Know 47 50 40 28 27 30 24 20 20 10 0 0-2 Servings 3-4 Servings 5+ Servings Fruits and Vegetables Believed Needed p<.001 Source: California Department of Health Services, Preliminary data.
California Children Aware of 5 a Day-Power Play! Campaign TV Spots Were More Likely to Eat 5 or More Servings of Fruits and Vegetables, 1999 Percent of Children 60 Aware of 5 a Day-Power Play! Yes No/Don't Know 50 40 39 38 40 30 26 25 17 20 12 10 5 0 0 Servings 1-2 Servings 3-4 Servings 5+ Servings Fruit and Vegetable Intake p<.05 Source: California Department of Health Services, Preliminary data.
Associations Between Who Makes Meals and Snacks and Fruit and Vegetable Intake, 1999 Percent of Children Who Ate a Serving of Fruit or Vegetable 80 71 Who Made Meal/Snack 70 Child Alone Mom/Dad/Adult 56 60 School 52 47 50 40 29 30 21 20 15 7 10 0 After-School Breakfast*** Lunch** Snack*** ** p<.01; *** p<.001 Source: California Department of Health Services, Preliminary data.
California Children Who Participated in School Meals Were More Likely to Eat 5 or More Servings of Fruits and Vegetables, 1999 Percent of Children Meeting 5 a Day Goal Participated in School Meals 40 37 Yes No 30 23 20 17 16 10 0 School Lunch** School Breakfast*** ** p<.01; *** p<.001 Source: California Department of Health Services, Preliminary data.
California Children's Access to Soda Vending Machines, Candy Vending Machines, and Fast Food on School Campuses, 1999 Percent of Children 30 24 25 20 16 15 10 8 5 0 Vending Machine Vending Machine with School Cafeteria Serves Fast Food with Soda Chips and Candy Source: California Department of Health Services, Preliminary data.
Soda vending machines at school Ate significantly fewer servings of vegetables (0.7 vs. 1.3 servings, p<.001) Vending machines stocked with chips and candy at school Ate significantly fewer servings of salad (0.1 vs. 0.3 servings, p<.001) Vending Machines Linked to Vegetable Intake
California Children's Participation in Physical Education by Total Minutes of Daily Physical Activity, 1999 Minutes of Physical Activity 96 100 93 91 80 69 66 60 40 20 0 None 1 or Less Times 2 Times 3-4 Times 5 Times Physical Education Per Week Source: California Department of Health Services, Preliminary data.
Schools made students exercise (84 vs. 63 minutes of daily PA, p<.01) Children who participated in PE 2 or more times per week (22-30 minutes more daily PA, p<.001) Physical Education Linked to Daily Physical Activity
Prioritize Campaign Activities:Food Preparation • Encourage children to participate in school meal programs
Address soda vending machines, vending machines stocked with chips and candy, and fast food in schools Replace soda, chips, and candy with more nutritious foods Promote the voluntary adoption of school nutrition guidelines Educate legislators Prioritize Campaign Activities:School Environment
Encourage schools to enforce existing PE requirement of 200 minutes of PE every 10 days Promote the voluntary adoption of school PE guidelines Educate legislators Prioritize Campaign Activities:School Environment
Angie Keihner 916-449-5389 akeihner@dhs.ca.gov www.ca5aday.com