Download
1 / 47
470 likes | 630 Views
COAL- ENERGY. AUGUST 2013. Energy Sector 2013- C0al. By: B.M.VERMA Advisor- Essar Power (M.P.) Ltd. Ex- Chairman Jharkhand State Electricity Board Ex Chairman / Jharbihar Collier Ltd. Ex Chairman/ Karanpura Energy Ltd. Ex- CMD/ Uttarakhand Power Corporation Limited

E N D
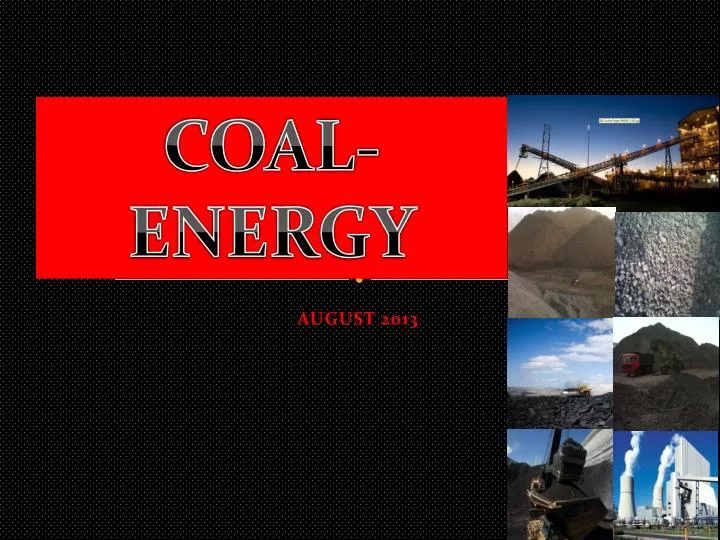
COAL- ENERGY AUGUST 2013
Energy Sector 2013- C0al By: B.M.VERMA Advisor- Essar Power (M.P.) Ltd. Ex- Chairman Jharkhand State Electricity Board Ex Chairman / Jharbihar Collier Ltd. Ex Chairman/ Karanpura Energy Ltd. Ex- CMD/ Uttarakhand Power Corporation Limited Contact: +91- 9810588500/9899337132 Email: bmverma@yahoo.com
POWER CUT Date: 06-04-06 & 07-04-06 Power Cut Unrestricted Demand Demand Met (Total Availability) Hydro Gen. Net Import from Grid Time in Hrs.
Other Sources • Hydro • Gas • Tapi • Iran • Bangladesh • Nuclear • Solar • Wind • Shale Gas
Demand Supply Scenario of Coal in India • India has fifth largest coal reserves in the world with power sector consuming ~70% of domestic coal produced in the country. Coal accounts for 69% of total power generated in the country • India’s coal demand increased at CAGR of 8.5% in the 11th plan. Compared to this, CIL’s domestic production during this period increased at a CAGR 4.6% only
Need For Coal • It is estimated that investments of about Rs 340,000 crores are impacted on account of current Affected Capacity of 71,900 MW • Limited availability of coal has impacted new power plants and also existing ones. Shortage in domestic coal production estimated at 64 MPTA for 2012. • Stranded Capacity is derived from Affected Capacity and refers to the actual shortfall in generation due to non-availability of adequate coal and gas. • Current Stranded Capacity is estimated at 17,300 MW. • Generation loss on account of this is estimated at about Rs 42,000 crores (120 billion units @ Rs 3.50 per unit) which works out to about 0.45% of Gross Domestic Product (GDP)
Coal Reserves in India • Total Resources ~ 285.90 Bt; Proved ~ 114 Bt • Total Production in FY11 ~ 532 Mt, largely non coking (~93%) • Power sector is single largest coal consumer, approx 64 % supplied to the sector • Indian coal is generally high ash, low sulphur • Average heat value ~ 4400 kcal/kg Coal Industry in India (01.04.2011) Power sector remains the largest consumer of coal at about 401.0 million tonnes per annum (MTPA) for FY2012 accounting for ~ 75% of total coal consumption Coal present in 10 out of 28 states
Challenges for enhancing domestic coal production – Coal India • Land Acquisition is the biggest bottleneck in coal mining operations • CIL faced prolonged delays in implementation of its projects leading to loss of production • Even after acquisition, possession of land presents another problem to the company Land Acquisition - Delay in conducting Public Consultations - SPCB takes considerable time to issue Consent to Establish and Consent to Operate • Environment Clearance given up only to a certain capacity (projected peak production) for specific project. Further capacity expansion requires new clearance which again a prolonged process • Forestry clearance takes much longer time and even being denied. Environment & Forestry Clearance - The progress of new railway line projects related to coal evacuation have not achieved the desired progress in the last few years (Tori-Shivpur-Hazaribagh, Angul-Kalinga, Gopalpur-Manoharpur, • Non-availability of sufficient number of railway rakes • CCL , MCL & BCCL particularly facing the problems in dispatch of coal and increasing coal inventory levels Evacuation Infrastructure
Port Logistics WEST COAST # of Ports Gujarat 40 Maharashtra 53 Goa 5 Daman & Diu Port 2 Karnataka 10 Kerala 13 Lakshadweep Islands 10 EAST COAST # of Ports Tamilnadu 15 Pondicherry 1 Andhra Pradesh 12 Orissa 2 West Bengal 1 Andaman & Nicobar Islands 23
New Thermal Coal Supply Sources US / Canada / Colombia – Attractive Ocean Freight s will result into supplies into Pacific Markets including India. China – May ban import of High Ash and High Sulphur Thermal coal with GCV (ARB) below 4,800 Kcal/Kg.
World Coal Reserve 147 BT Russia Europe 246 BT 50 BT 59 BT 115 BT China North America India 32 BT 20 BT 15 BT Africa Indonesia 76 BT Latin America Australia Total World 826 BT
Global Coal Production (Million tonnes) Canada Russia 68 335 Europe CIS 993 674 China 248 U.S. 3520 589 India Asia / Pacific 65% 260 325 Africa Indonesia 101 416 Latin America Australia Asia Pacific Now dominant in Global Coal production and supply
Changing Global Coal Sea borne Trade SA Exports 2007 Europe : 42 Million T World Sea borne Trade 2010 India : 9.22 MMT China: 20 MMT Rest Asia: 8.6 MMT • Factors : - • Ocean Transportation cost(s) • Voyage • Availability & Domestic consumption • Regulatory issues • Economy including currency • Coal Cost(s) Europe : 14.6 Million T India : 22.98 MMT China: 12.8 MMT Rest Asia: 13.83 MMT SA Exports 2012
Host of Factors driving Coal Market Dynamics M & A i.e. Glencore -Xstrata Demand Drivers Local Issues, Mining & Labour costs Index linked spot / term contracts, Cost plus basis, Dividend Availability and cost of shale Gas, Oil prices for mining costs Low /High CV, S, TM, VM Australian Tax for mining coal, Indian Clean Energy cess Change in Coal prices (Import & Export) due to appreciation / depreciation
Thermal Coal Imports in India INDONESIA India’s Thermal Coal Imports ~ 83.4 Million tonnes INDIA Imported ~ 107 MillionTonnes of Thermal Coal in 2012 Other Countries : ~ 4.3 Million Tonnes AUSTRALIA India’s Thermal Coal Imports ~ 2.1 Million tonnes SOUTH AFRICA India’s Thermal Coal Imports ~ 17 Million tonnes
Volatile International Thermal Coal Prices (April’2011 – July 19th, 2013) - 27.5% - 41.3% + 8% - 10% - 37.5% - 7% + 6% - 30% - 34% * ARGUS FOB Prices ( 90 Days Forward)
Indonesia Coal Benchmark FOB Prices (HBA) IN US$ / MT {January 09 – August 13} - 39.6% + 101.4% The HBA is the minimum price used for the calculation of taxes for producers pay for all future exports and domestic coal sales. It is calculated using a basket of indices, including the price is a monthly average of the Indonesia Coal price Index (ICI-1), Platts-1, Newcastle Export Index and the globalCOAL Index from the previous month.
China, India Coal Imports Expected to Grow 10% – 15% in 2013 China & India Coal Imports in Million tonnes CHINA INDIA • Coal imports up 25% in Q1 • Coal generation up 9% • Domestic coal production below targets; Minister of Coal calling for increased imports • New port projects underway to enable greater imports • ~70 GW of new coal generation by 2017 • Coal imports up 30% in Q1 • Coal generation up 4% • Q1 7.7% GDP growth exceeds government targets • Urbanization expected to send 15 to 20 million people to cities each year • ~250 GW of new coal generation by 2017
Global Seaborne Supply: Australia and Indonesia Expected to Lead Growth
INDIA – Future Projections Demand Growth 7 -8% (5 year CAGR) as against ~ 5% production growth In overall terms, GAP between projected demand of 980.50 MT and the projected domestic availability of 715 MT works out to be 265.5 MT in year 2016-17. (235 MT Thermal Coal and 30.5 MT Coking Coal)
Market Spotlight : India & China • INDIA: Fastest Growing Coal Importer • Long – term coal use could quadruple to 2 billion TPA. • Heavy reliance on imported coal. • Bridge between Atlantic and Pacific markets. • Segmented between public & private sector. • CHINA : Largest & Fastest Growing Coal Market • Tight supply – demand balance. • Production costs increasing • Small mine closures continuing. • Transportation & taxes encourages imports.
GOING FORWARD …………… ….. • Thermal coal prices face downside risk. Thermal coal prices to drift lower in the coming months. Supply remains strong overall. However, Atlantic demand is thinning, while Pacific demand is not robust enough to absorb market excesses. • Atlantic demand is fading as summer approaches, and demand from China is lower on potentially strong hydropower generation and, above all, strong overall supply. • China’s hydropower generation, up 15% y/y in March, looks set to outperform again this summer as reservoirs remain at above-average levels; this will be a drag on thermal coal demand. • Coal inventory restocking in China is unlikely to see a corresponding increase in seaborne coal prices. • Standard Chartered has lowered their 2013 Newcastle price forecast to USD 89/tonne (t) (from USD 94/t previously) and their 2014 forecast to USD 91/t (from USD 96/t) to reflect current market sentiment.
GOING FORWARD …….. …….. …… • Tough times ahead for producers – near/mid term buyers market. • Indonesian and Australia face competition from each other and the wider market. • Demand will be there and continue to grow, however, market [prices] will recover when demand over takes supply again. • China being largely a spot market means business is increasingly being pushed towards the prompt. • Indian will buy when the price works, which should be ok for the near term, especially as freight is relatively cheap. • Whilst prices may remain relatively soft in the near term, they will become increasingly volatile in the prompt. • Indonesia maintains almost monopoly on sub-bituminous and low rank exports, • ideally situated between the growth markets of India and China.
Queries to Be Answered. • Affect of Currency Depreciation • Current Account Deficit
Coal Expected to Overtake Oil As World’s Largest Energy Source in 2013 Total World Primary Energy Demand by Fuel
Annual World Coal Demand Expected to Grow ~1.4 Billion Tonnes in Five Years
Coal Remains the Most Affordable Fuel Comparative Costs of Key Primary Energy Fuels
Existing Coal Futures Markets • Coal futures contracts are not yet liquid and it is risky to lock price for long term. • There is no depth in futures markets as very low participation of Speculators. • Most of coal future contracts are cash settled (financial settlement) and delivery happens for few U.S. Coal contracts and API 2 (CIF ARA) on CME. • On intraday basis, there is not much volatility which stops speculators to enter the markets as they look at an opportunity with change in intra day prices. • Coal prices depends upon logistics / ocean transportation, customer base, local issues i.e. regulatory, economy, weather, demand - supply etc. and it is not necessary that increase in Indonesian coal price will lead to increase in SA and / or Australian and / or U.S. coal(s) too. • Coal forward prices are mostly determined by financial institutions and brokers as trade happens through OTC. Coal end-users hardly participate to mitigate price risks.
Demand Supply Scenario of Coal in India • India has fifth largest coal reserves in the world with power sector consuming ~70% of domestic coal produced in the country. Coal accounts for 69% of total power generated in the country • India’s coal demand increased at CAGR of 8.5% in the 11th plan. Compared to this, CIL’s domestic production during this period increased at a CAGR 4.6% only
Demand Supply Scenario of Coal in India – Imported Coal Scenario • Most of the Indian Power Sectors are now looking for imported Coal • India’s coal imports have more than doubled over the last five years • There is a huge price difference between domestic and imported coal • In addition the dynamism in the regulations of the countries from where coal is being imported pose further hurdles by way of political risks. • The Indonesian government implemented the Indonesian Coal Price Regulation, which requires prices for all transactions to be benchmarked against a set of international and domestic indices and all sale contracts to be modified retrospectively by September. Several developers have already entered into long term PPA’s with distribution utilities based on fuel tied up from Indonesian mines which have now been covered under the new law posing uncertainty over the operational viability of the affected plants
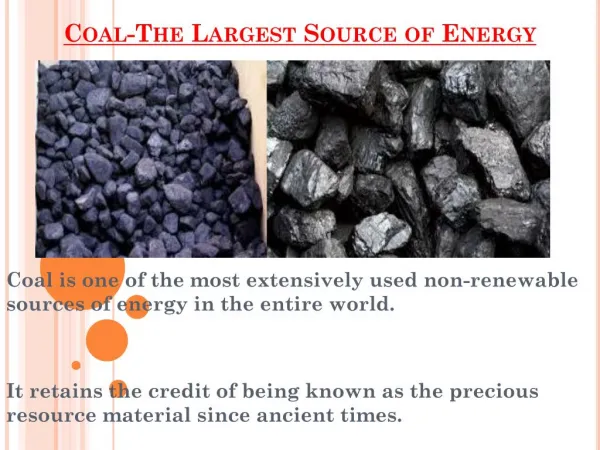
KING COAL ! • Reserves • Proven 91 billion Tons • Indicated 116 billion Tons • Inferred 37 billion Tons • TOTAL 245 billion Tons • Coal reserves: > 250 years at present levels of consumption • Concentrated in Eastern India