Download
1 / 38
380 likes | 470 Views
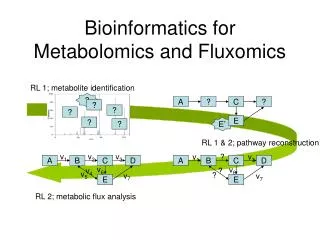
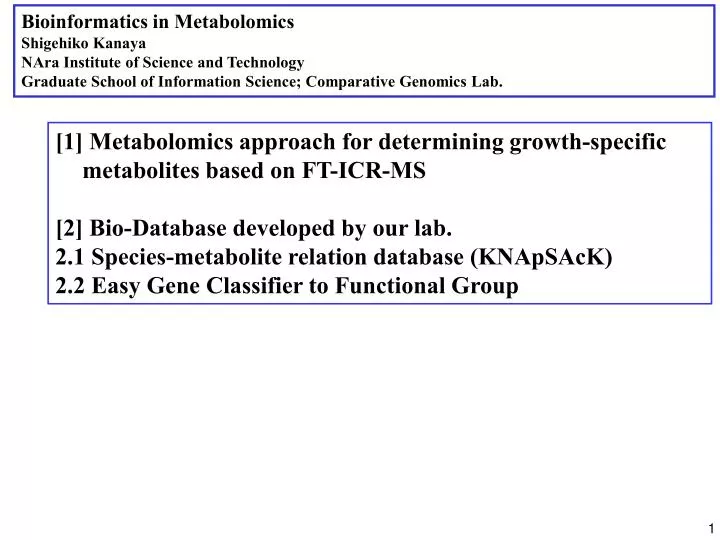
Bioinformatics in Metabolomics Shigehiko Kanaya NAra Institute of Science and Technology Graduate School of Information Science; Comparative Genomics Lab. [1] Metabolomics approach for determining growth-specific metabolites based on FT-ICR-MS [2] Bio-Database developed by our lab.

E N D
Bioinformatics in Metabolomics Shigehiko Kanaya NAra Institute of Science and Technology Graduate School of Information Science; Comparative Genomics Lab. [1] Metabolomics approach for determining growth-specific metabolites based on FT-ICR-MS [2] Bio-Database developed by our lab. 2.1 Species-metabolite relation database (KNApSAcK) 2.2 Easy Gene Classifier to Functional Group
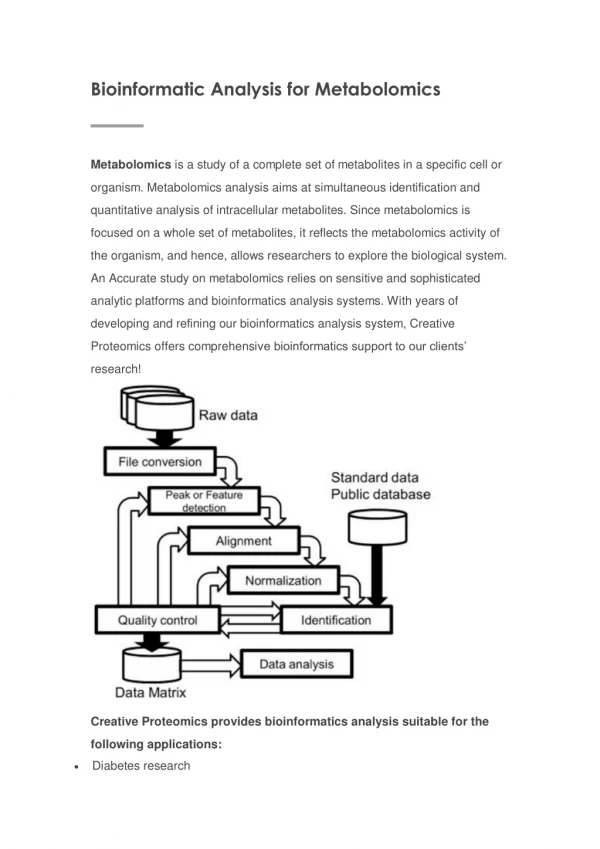
10 T8 T6 T7 T5 T4 T3 T2 1 OD600 T1 0.1 0 200 400 600 800 Time (min) Data Processing from data acqisition of a time series experiment to description of cellular conditions (a) Time series experiments DrDMASS (b) Data preprocessing and constructing data matrix Time point (c) Classification of ions into metabolite-derivative group m/z M Metabolite-derivative group (Isotope ions and multivalent ions) M+1 DPClus M/2 (d) Annotation of ions as metabolites (e) Assessment of cellular condition by metabolite composition KNApSAcK DB
FT-ICR/MS(Fourier transform ion cyclotron resonance MS) Metabolomics research has been performed by GC-MS, LC-MS, CE-MS, NMR. FT-ICR/MS can offer extremely high levels of resolution and sensitivity. High accurate mass Assign to molecular formula i.e.) Experimetal m/z = 662.1037 NAD+ theoretical m/z = 662.1019 (Δ= 0.0018, 2.7ppm)
Predicted number of molecular formula by high accurate mass 597 C10H10O6 MW:226.0477380528 # of candidates 251 Chorismic acid Isochorismic acid 32 3 Error
Data set (E.coli time-series) 10 T8 T7 T6 T5 Conditions T4 T3 T2 E.coli W3110 LB medium 2000ml Agitation 300rpm Air 2l/h Temperature 37℃ Start pH 7.4 8 time points 1 T1 OD600 0.1 0.01 ・Collect cells by membrane filter ・Extract metabolites by methanol 0.001 200 400 600 800 0 Time (min)
(i) (ii) (iii) (iv) Bioinformatics DrDMASS+ KNApSAcK (iii) Unsupervised learning PCA, BL-SOM (iv) Supervised learning PLS KNApSAcK search # of metabolites 20752 # of species-metabolite pairs 41206 (i) Peak Correction (ii) Multivariate data processing Sample A1 Sample A1 Sample A2 Sample A2 Sample A3 Sample A3 Sample B1 Sample B1 Sample B2 Sample B2 Sample B3 m/z Sample B3
(i) Peak correction (ii) Multivariate data processing DrDMASS+ KNApSAcK (i) (ii) (iii) (iv) (iii) Unsupervised learning PCA, BL-SOM (iv) Supervised learning PLS KNApSAcK search # of metabolites 20752 # of species-metabolite pairs 41206 (i) Peak Correction (ii) Multivariate data processing Sample A1 Sample A1 Sample A2 Sample A2 Sample A3 Sample A3 Sample B1 Sample B1 Sample B2 Sample B2 Sample B3 m/z Sample B3
Validation of data processing (b) Data preprocessing and constructing data matrix (i) Peak correction (ii) Multivariate data processing Metabolite peak IMC peak 3.5×10⁻⁶ Before correcting 2.5×10⁻⁶ After correcting Scan 3 Scan 2 2.0×10⁻⁶ Scan 1 Coefficient of variation (CV) 1.5×10⁻⁶ (i) m/z correction among each scan (ii) Peak matching among 10scans (multivariate data processing) 1.0×10⁻⁶ 0.5×10⁻⁷ Scan 3 0 Peak1 Peak2 Peak3 IMC Peak4 Scan 2 Scan 1 Oikawa et al, (2006)
M-12 M-8 5 M-11 4 3 M-9 M-5 M-10 6 M-14 M-4 9 M-7 M-6 2-3 M-13 8 M-15 7 10 2-2 M-16 11 PG10 M-17 1-3 PG9 PG3 M-3 M-2 PG4 1-4,5 1-1 M-1 PG7 PG6 PG1 PG2 2-1 PG8 (c) Classification of ions into metabolite-derivative group (DPClus) PG5 1-6 1-2
(iii) Unsupervised learning (PCA) DrDMASS+ KNApSAcK (i) (ii) (iii) (iv) (iii) Unsupervised learning PCA, BL-SOM (iv) Supervised learning PLS KNApSAcK search # of metabolites 20752 # of species-metabolite pairs 41206 (i) Peak Correction (ii) Multivariate data processing Sample A1 Sample A1 Sample A2 Sample A2 Sample A3 Sample A3 Sample B1 Sample B1 Sample B2 Sample B2 Sample B3 m/z Sample B3
PCA analysis (iii) Unsupervised learning (PCA) 10 T7 T8 T6 T5 T4 220 dims. → 2 dims. T3 T2 1 T1 Metabolic profiling could distinguish between exponential and stationary phases. (220 independent ions) OD600 0.1 0.01 600 800 0 200 400 Time (min) 2.0 T7 T2 T3 T8 0.0 T4 T1 PC2 (2.4%) T5 T6 The first two principal components, which can explain 96.7% of total variance, are enough to examine the differences in 8 time points. (SUM=1) Exponential-phase Stationary-phase -4.0 -8.0 0.0 12.0 PC1 (94.3%) Which metabolite is representative at each stage?
(iv) Supervised learning DrDMASS+ KNApSAcK (i) (ii) (iii) (iv) (iii) Unsupervised learning PCA, BL-SOM (iv) Supervised learning PLS KNApSAcK search # of metabolites 20752 # of species-metabolite pairs 41206 (i) Peak Correction (ii) Multivariate data processing Sample A1 Sample A1 Sample A2 Sample A2 Sample A3 Sample A3 Sample B1 Sample B1 Sample B2 Sample B2 Sample B3 m/z Sample B3
PLS(Partial Least Squares) (iv) Supervised learning PLS - Is supervised regression method. - Can extract important combinations of variables. - Can work with many responses. factors/predictors responses K=1 M=220 PLS Y X Observations N=8 N=8 We tried to estimate the cell condition based on a function of the composition of metabolites. OD600 = a1 x1 +…+ aj xj +….+ aM xM xj, the quantity for jth
Partial Least Square Modeling -------- Time ------ OD600 ----- Metabolite quantity data ----- y = a0 x0+a1 x1 +…+ aj xj +….+ aM xM Optimization of wkfor correration betweenxkand y
Partial Least Square Modeling Minimization of square of error. Minimization of square of error. y = a0 x0+a1 x1 +…+ aj xj +….+ aM xM
Advantages of PLS y = a0 x0+a1 x1 +…+ aj xj +….+ aM xM PLS MRA(重回帰) # of samples << # of variables # of samples > # of variables x Correlation of variables
PLS regression modeling 5.0 r = 0.97 T8 T7 T6 OD600 = a1 x1 +…+ aj xj +….+ aM xM xj , the quantity for jth aj > 0, stationary-phase dominant metabolites Predicted OD600 value T5 aj < 0, exponential-phase dominant metabolites T4 T1 T2 T3 0.0 0.0 5.0 Observed OD600 value Our constructed model - Could work well because of r = 0.97. - Is informative to clarify the relation between a growth stage and metabolic profile.
Coefficients in the constructed model OD600 = a1 x1 +…+ aj xj +….+ aM xM xj , the quantity for jth aj > 0, stationary phase-dominant metabolites aj < 0, exponential phase-dominant metabolites The ions with the negative and positive coefficients contribute to the constructed model, negatively and positively, and are dominant in exponential and stationary phase, respectively. 0.1 aj 0.0 -0.15 Exponential-phase dominant Stationary-phase dominant
KNApSAcK search DrDMASS+ KNApSAcK (i) (ii) (iii) (iv) (iii) Unsupervised learning PCA, BL-SOM (iv) Supervised learning PLS KNApSAcK search # of metabolites 20752 # of species-metabolite pairs 41206 (i) Peak Correction (ii) Multivariate data processing Sample A1 Sample A1 Sample A2 Sample A2 Sample A3 Sample A3 Sample B1 Sample B1 Sample B2 Sample B2 Sample B3 m/z Sample B3
Coefficients in the constructed model OD600 = a1 x1 +…+ aj xj +….+ aM xM xj , the quantity for jth aj > 0, stationary phase-dominant metabolites aj < 0, exponential phase-dominant metabolites Red: E.coli metabolites Black: Other bacterial metabolites 0.1 omega-Cycloheptylnonanoate dTDP-6-deoxy-L-mannose MS/MS analyses Parasperone A omega-Cycloheptylundecanoate, cis-11-Octadecanoic acid UDP-glucose, UDP-galactose UDP aj 733.5056 (PG2) Octanoic acid UDP-N-acetyl-D-glucosamine UDP-N-acetyl-D-mannosamine dTMP, dGMP, 3'-AMP 761.5293 (PG4) NADH Lenthionine 0.0 Argyrin G omega-Cycloheptyl-alpha-hydroxyundecanoate MS/MS analyses ATP, dGTP omega-Cycloheptyl-alpha-hydroxyundecanoate dTDP 747.5183 (PG3) Glyoxylate ADP, Adenosine 3',5'-bisphosphate, dGDP ADP-(D,L)-glycero-D-manno-heptose 719.4868 (PG1) NAD -0.15 Exponential-phase dominant Stationary-phase dominant
100 100 100 100 Ion intensity Ion intensity Ion intensity Ion intensity 0 0 0 0 MS/MS analyses 253.2181 [R2O]- 255.2337 [R1O]- 391.2260 [M-C3H6O2 - H - R2OH]- R1= R2= 719.4868 (PG1) 465.2628 [M - H - R2OH]- 719.4868 [M -H]- 483.2735 [M - R2]- 267.2339 [R2O]- 255.2338 [R1O]- R1= R2= 391.2268 [M-C3H6O2 - H - R2OH]- 733.5056 (PG2) 465.2639 [M - H - R2OH]- 733.5056 [M - H]- 483.2741 [M - R2]- 281.2502 [R2O]- 255.2345 [R1O]- R1= R2= 747.5183 (PG3) 465.2659 [M - H - R2OH]- 391.2281 [M-C3H6O2 - H - R2OH]- 483.2744 [M - R2]- 747.5183 [M - H]- 295.2654 [R2O]- 465.2651 [M - H - R2OH]- R1= R2= 255.2342 [R1O]- 391.2271 [M-C3H6O2 - H - R2OH]- 761.5293 (PG4) 761.5293 [M -H]- 483.2772 [M - R2]- 100 200 300 400 500 600 700 800 m/z
Summary of phosphatidylglycerols detected in this study (a) Elucidated structures (PG1 to PG4) ID Combination of three substructures (X1, X2, X3) PG1 PG2 PG3 PG4 (b) Relation of mass differences among PG1 to 10 (Cluster 1) PG5 30:1(14:0,16:1) PG1 32:1(16:0,16:1) PG3 34:1(16:0,18:1) ∆(CH2)2 ∆(CH2)2 28.0281 28.0315 2.0138 US CFA 14.0170 CFA 14.0187 CFA 14.0110 PG7 34:2(16:1,18:1) PG9 36:2(18:1,18:1) ∆(CH2)2 28.0330 PG6 31:0(14:0,c17:0) PG2 33:0(16:0,c17:0) PG4 34:5(16:0,c19:0) ∆(CH2)2 ∆(CH2)2 CFA 14.0181 CFA 14.0197 28.0298 28.0237 2.0051 US PG8 35:1(16:1,c19:1) PG10 37:1(18:1,c19:0) ∆(CH2)2 (Cluster 2) 28.0314
Cyclopropane fatty acid (CFA) formation 4.0 T1 T2 T3 T4 T5 T6 T7 T8 PG1 0.0 Ratio of relative ion intensity PG2 PG2/PG1 PG4/PG3 CFA formation occurs as the cells enter into stationary phase. -8.0 PG3 PG4 • Constructed model using PLS regression would be useful for extracting of characteristic variables. • CFA formation of PGs occurs, as E.coli enters stationary phase.
[1] Metabolomics approach for determining growth-specific metabolites based on FT-ICR-MS [2] Bio-Database developed by our lab. 2.1 Species-metabolite relation database (KNApSAcK) 2.2 Easy Gene Classifier to Functional Group
KNApSAcK link versionhttp://kanaya.naist.jp/knapsack_jsp/top.html
KNApSAcK(http:/kanaya.naist.jp/KNApSAcK)(Since 2004) Authors who utilize KNApSAcK DB ( Thanks!) Farder, A. et al., J. Nutrition, 138, 1282-1287, (2008)(Red, in Japan) Takahashi, H., Anal. Bioanal Chem. (in press) (2008) Mintz-Oron, S., et al., Plant Physiol.,147,823-825, (2008) Iijima, Y., et al., Plant J., 54, 949-962, (2008) Overy, D.P., et al., Nature Protocols, 3, 471-485, (2008) Dunn, W.B., Physical Biol., 1-24, 5, (2008) Want, E.J. et al., J. Proteome Res., 6, 459-468, (2007) Sofia, M., et al., Trends in Anal. Chem., 26, 855-866, (2007) Ohta, D., et al., Anal.Biol. Chem.(2007) Nakamura, Y., et al., Planta, (2007) Suzuki, H., et al., Phytochemistry, (2007) Sakakibara, K., et al., , J .Biol. Chem.,282, 14932-14941, (2007) Saito, K. et al., Trends in Plant Sci., 13, 36-42, (2007) Hummel, J., et al., Topics in Curr. Genet., 18, 75-95, (2007) Gaida, A., and Neumann, S., J. Int. Bioinf., (2007) Kikuchi, K and Kakeya, H., Natuure Chem. Biol., 2, 392-394, (2006) Oikawa, A.,et al.,Plant Physiol., 142, 398-413, (2006) Shinbo, Y., et al.,Biotchnol. Agric. Forestry, 57, 166-181, (2006) Shinbo, Y., et al.,J. Comput. Aided Chem., 7, 94-101, (2006) (WikiBook) http://en.wikibooks.org/wiki/Metabolomics/Databases (UC Davis)http://fiehnlab.ucdavis.edu/staff/kind/Metabolomics/Structure_Elucidation/ (KEGG) http://fire3.scl.genome.ad.jp/dbget-bin/www_bfind?knapsack (LECO社マニュアル)
Linked by KEGG DB http://fire3.scl.genome.ad.jp/dbget-bin/www_bfind?knapsack
KNApSAcK – Lupin Alkaloidshttp://kanaya.naist.jp/knapsack_jsp/lupin/top.html
[2] Other DB developed in our groupFunction annotation DB for Arabidopsis thalianahttp://kanaya.naist.jp/arabidopsis/top.jsp Functional annotations14502 genes Cellular Localization inf.2242 genes
Categorization of gene pairs into pairs of functional classes
[3] DB for Edible Organisms http://kanaya.naist.jp/LunchBox/top.jsp
Allium cepa Link to KNApSAcKDB
Time series change of total number of detected ions (a) 10 T7 T8 T6 T5 T4 T3 OD600 T2 1 T1 0.1 (b) 120 Number of detected ions 0 (c) Cluster 5 1.0 0.0 Cluster 3 1.0 Relative ion intensity 0.0 Cluster 1 1.0 0.0 Cluster 2 1.0 0.0 Cluster 4 1.0 0.0 0 800 Time (min)