Download
1 / 6
70 likes | 192 Views
Labor Force Participation Rates Measuring workforce engagement. Date last updated: September 9, 2013. DataPost. Federal Reserve Bank of San Francisco Economic Education Group. Labor Force Participation Rates Monthly percentage values, seasonally adjusted, through August 2013. DataPost.

E N D
Labor Force Participation RatesMeasuring workforce engagement Date last updated: September 9, 2013 DataPost Federal Reserve Bank of San Francisco Economic Education Group
Labor Force Participation RatesMonthly percentage values, seasonally adjusted, through August 2013 DataPost Source: Bureau of Labor Statistics http://www.frbsf.org/education/teachers/datapost/index.html FRBSF Economic Education Group
The percentage of the age 16+ population (within each subgroup shown) working or actively looking for work Annotated Chart NotesLabor Force Participation RatesMonthly percentage values, seasonally adjusted, through August2013 Prime-age men (25-54 years old) 96.1 % in Aug. 1969 Youth aged 16-24 55.5% in Oct. 2009 Prime-age women (25-54 years old) 55.1% in Jun. 1975 Mature 55+ years old 40.5 % in Aug. 2013 DataPost Source: Bureau of Labor Statistics http://www.frbsf.org/education/teachers/datapost/index.html FRBSF Economic Education Group
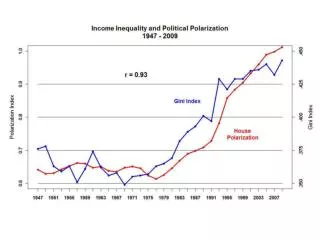
Overall Labor Force Participation RateYearly averages of monthly values* (Percent) ---- CBO Forecast DataPost Sources: Bureau of Labor Statistics & Congressional Budget Office *Labor force participation rate is through 2011 based on CBO forecast availability http://www.frbsf.org/education/teachers/datapost/index.html FRBSF Economic Education Group
The fraction of the age 16+ population working or actively looking for work Annotated Chart NotesOverall Labor Force Participation RateYearly averages of monthly values* (Percent) CBO Forecast ---- Peaked at 67.1 % in 1997 The CBO forecasts the rate will drop to 63.0% by 2021 See PowerPoint file for CBO Forecast source. DataPost Sources: Bureau of Labor Statistics & Congressional Budget Office *Labor force participation rate is through 2011 based on CBO forecast availability http://www.frbsf.org/education/teachers/datapost/index.html FRBSF Economic Education Group
What Do You Think? • What is the labor force participation (LFP) rate definition? (See slide 5) • To which demographic group do you belong? In January 2008, what was the approximate value of the LFP rate for your group? (See slide 2) • For the periods shown in the LFP rate chart by subgroup, what can you say about the trend for participation among men aged 25-54? Women aged 25-54? Youth aged 16-24? (See slide 3) • How would you describe the trend in the overall LFP rate since January 1998? (See slide 4) • How does the trend in the LFP rate mature 55+ subgroup compare before and after the Great Recession (Dec. 2007 – Jun. 2009)? (See slide 3) Watch a video about U.S. labor force participation rates at FRBSF.org DataPost http://www.frbsf.org/education/teachers/datapost/index.html FRBSF Economic Education Group