Download
1 / 38
380 likes | 493 Views
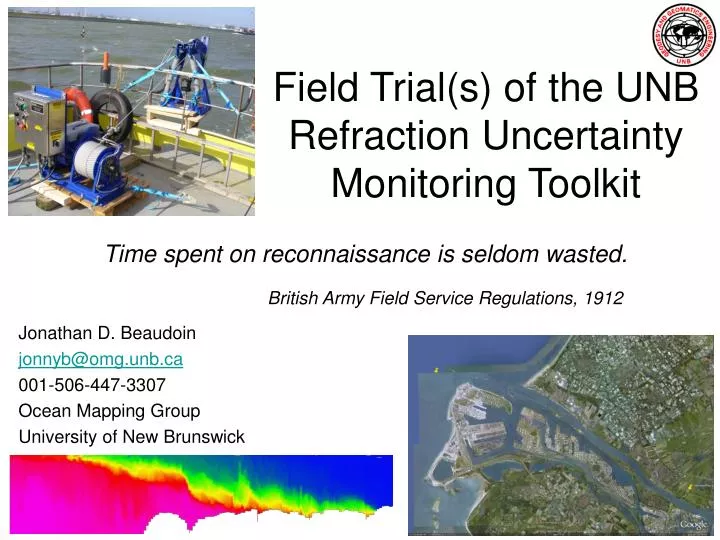
Time spent on reconnaissance is seldom wasted. British Army Field Service Regulations, 1912. Field Trial(s) of the UNB Refraction Uncertainty Monitoring Toolkit. Jonathan D. Beaudoin jonnyb@omg.unb.ca 001-506-447-3307 Ocean Mapping Group University of New Brunswick. Outline.

E N D
Time spent on reconnaissance is seldom wasted. British Army Field Service Regulations, 1912 Field Trial(s) of the UNB Refraction Uncertainty Monitoring Toolkit Jonathan D. Beaudoin jonnyb@omg.unb.ca 001-506-447-3307 Ocean Mapping Group University of New Brunswick FEMME 2009 Lisbon, April 21-24
Outline • Real-time assessment of refraction uncertainty • Acoustic aiding • Field Trials: • Lower Saint John River estuary • Rotterdam Waterway • Survey REA with MVP and Acoustic Aiding FEMME 2009 Lisbon, April 21-24
Assessing Refraction Artifacts in Real-Time • Highly subjective • Requires constant vigil • Can overreact over flat seafloors • Can “underreact” over complicated topography • Impossible for iso-velocity displays (e.g. Reson 81XX display) FEMME 2009 Lisbon, April 21-24 www.reson.com
Depression angle TWTT Investigation depth TWTT Sound speed Depth UNB/OMG Method:Raytracing Simulation • Isolates raytracing portion of depth reduction procedure: no sounding data required! • Requires accurate model of raytracing procedure: • Draft • Angular sector • Survey depth • Surface sound speed probe 2 1 • Compute common TWTT • Raytrace in test watercolumn • Difference the solutions 3 Depth bias FEMME 2009 Lisbon, April 21-24 Horizontal bias
Sound speed Depth Investigation over Entire Potential Sounding Space “Smile” artifacts near surface Bias cancels out at mid-depth “Frown” artifacts at depth It’s important to see the whole picture FEMME 2009 Lisbon, April 21-24
EM3002D watercolumn imagery courtesy of Dutch Navy, processed by A. van der Werf EM3002 watercolumn imagery from CSL Heron, processed by A. van der Werf Why Examine the ENTIRE Potential Sounding Space? ? FEMME 2009 Lisbon, April 21-24
Sound speed Depth Uncertainty Wedge Bias (%w.d.) FEMME 2009 Lisbon, April 21-24
Sound speed Depth Simplification for Real-Time Decision Making 0 - 0.25% w.d. 0.25 - 0.5% w.d. 0.5 - 0.75% w.d. 0.75 - 1.0% w.d. > 1.0% w.d. FEMME 2009 Lisbon, April 21-24
6 5 vs. 6 5 4 vs. 5 sound speed 6 4 3 vs. 4 5 4 3 2 1 3 depth 2 vs. 3 2 1 vs. 2 1 2 3 4 5 6 depth Snapshots of Refraction Bias Through an Evolving Watercolumn 1 FEMME 2009 Lisbon, April 21-24
6 5 5- 4 5- 3 sound speed 5 4 4 2 depth 4 1 Time Evolution of Bias Between Casts HUGE ASSUMPTION: Linear growth of bias with time Not unreasonable if you’re sampling at a high rate but DEFINITELY not applicable if you’re undersampling FEMME 2009 Lisbon, April 21-24
Comparison of cast 1 & 2 Comparison of cast 2 & 3 sound speed 3 depth 2 1 Real-Time Uncertainty Visualization Look direction It’s important to be able to visualize the time evolution and history of error FEMME 2009 Lisbon, April 21-24
Uncertainty Visualizationwith Acoustic Aiding Knudsen 200 kHz SBES Fresh Brackish Salt Salinity field, MVP30 Uncertainty field from Uncertainty Wedge Analysis Acoustic Aiding Data: - Watercolumn datagram - ADCP echogram, current strength & azimuth - Single beam echogram FEMME 2009 Lisbon, April 21-24 0 - 0.25% w.d. 0.25 - 0.5% w.d. 0.5 - 0.75% w.d. 0.75 - 1.0% w.d.
Textbook River outflow Reality Saline inflow salinity 0 32 UNB SVP Toolkit Field Trials • Saint John River, Canada, November 2008 • Rotterdam Waterway, Netherlands, March/April 2009 • Both areas require frequent dredging and resurvey to guarantee minimum clearance • Salt wedge estuaries, very challenging to survey FEMME 2009 Lisbon, April 21-24
Sound speed Temperature Salinity River outflow Saline inflow Why are these Areas So Challenging? (1) 0 As the change in sound speed can be quite dramatic at the interface between the fresh and salt water (20 m/s), soundings can refract quite strongly and can lead to significant sounding uncertainty with seemingly small variations in the interfacial depth. variability Dramatic sound speed gradient strongly refracts rays 20 10 20 30 6 8 1460 7 9 1440 FEMME 2009 Lisbon, April 21-24
Turbulence salinity 0 32 Why are these Areas So Challenging? (2) Animated image of the Moon's surface showing the effects of the Earth's turbulent atmosphere on the view through a telescope Image: P. Salzgeber FEMME 2009 Lisbon, April 21-24
CCGS Vector EM710 Watercolumn Imagery, Race Rocks, April 2009 FEMME 2009 Lisbon, April 21-24
0m 00 10 20 30 Depth (m) 40 Middle Rocks Area July 2005 HMS Endurance 50 Sound Speed (m/s) 1495 1500 1505 1510 1515 Tilted Interfaces The interfaces we image are not necessarily flat. Not really the SVP sensor’s fault, problem is invalidity of assumptions in raytracing model. 100m 50m FEMME 2009 Lisbon, April 21-24 Slide courtesy of J. Hughes Clarke
Effect of Tilted Interfaces Problem: Assumption of horizontal homogeneity is invalid: the watermass I can measure below me is not representative of the watermass across the entire swath. Effect: - We refract by the wrong amount and at the wrong depth for all beams away from nadir. - Incorrect refraction angle gives angular error, thus error grows with depth. - Nadir refracts slightly (we always assume it doesn’t). δ=34.15° 1510 m/s 4.87° 1500 m/s Reality δ=34.15° 1510 m/s Ray direction is incorrect in bottom layer by 0.11°!!! 1500 m/s The usual model FEMME 2009 Lisbon, April 21-24
Effect of Tilted Interfaces FEMME 2009 Lisbon, April 21-24
0 MVP30, Sound Speed Effect of Tilted Interfaces (real example) 20 15 min, ~2.5NM 40 0 Reson 8101, MVP30 1m 10 20 30 FEMME 2009 Lisbon, April 21-24 40 1455 1505
Practicalities:How to help the Hydrographer? • What a mess, how can we possibly ever hope to work in such difficult areas? • Work harder • Decrease line spacing • Collect more casts • Work smarter • MVP, Acoustics and Uncertainty Wedge Analysis for REA • Identify favourable survey windows, take advantage of them • Identify poor survey conditions, work around them FEMME 2009 Lisbon, April 21-24
Sound speed Temperature Salinity 0 16 8 3.7 7.7 11.7 1460 9 10 1440 Cast 3 Cast 4 Cast 5 time 40 sec, 140 m 5 10 pycnocline depth (m) Knudsen 200 kHz SBES 15 11 m ChallengingConditions 30 m UNB Uncertainty Monitoring Trials, Saint John River Gorge, Nov. 2008 40 sec, 140 m FEMME 2009 Lisbon, April 21-24
Finding Favourable Survey Windows Knudsen 200 kHz SBES 30 m ~1km FEMME 2009 Lisbon, April 21-24
Realizing what variability affects you most B A Pass 1 Pass 3 Pass 2 B A B B A A Knudsen 200 kHz SBES FEMME 2009 Lisbon, April 21-24
Realizing what variability affects you most B A Pass 1 Pass 1 Pass 3 Pass 3 Pass 2 Pass 2 Uncertainty Wedge Analysis Fresh Brackish Salt MVP30 Salinity Field FEMME 2009 Lisbon, April 21-24
salinity 0 32 Identify low turbulence tidal survey windows Rijkswaterstaat Rotterdam Waterway MVP-30 Trials, March/April 2009 JD084, Section 3 FEMME 2009 Lisbon, April 21-24 JD084, Section 2
Rijkswaterstaat Rotterdam Waterway MVP-30 Trials, March/April 2009 salinity 0 32 Flood vs. Ebb? Slackening high water JD084, Section 3 Falling tide JD092, Section 2 Middle of double low (agger) JD085, Section 1 Beginning to rise FEMME 2009 Lisbon, April 21-24 JD089, Section 4
Rijkswaterstaat Rotterdam Waterway MVP-30 Trials, March/April 2009 A MVP for REA B A B Use cast at A 250 m Use middle cast Use cast at B Analysis for 150° angular sector, 0.3m draft with surface sound speed probe FEMME 2009 Lisbon, April 21-24
Acoustics for REA Hunting for the end of the Salt Wedge UNB Uncertainty Monitoring Trials, Saint John River Gorge, Nov. 2008 10 20 Knudsen 200kHz SBES Brackish Fresh Use watercolumn acoustics to hunt for upstream edge of salt wedge at high slackwater. Confirm with sound speed cast. Salt 10 20 MVP30 Salinity Field FEMME 2009 Lisbon, April 21-24
Rijkswaterstaat Rotterdam Waterway MVP-30 Trials, March/April 2009 salinity 0 32 Chasing the Falling Tide JD089, Sections 2, 3 & 4 Once you find the edge of the salt wedge, work slightly upstream and chase it out to sea as the river flushes salt water out. Extreme retreats of the wedge may preferentially occur during spring or neap tides, which could be taken advantage of. FEMME 2009 Lisbon, April 21-24
Conclusion (1) • Ability to monitor watercolumn conditions as a source of uncertainty gives unprecedented control over refraction type biases • Surveyors can have confidence in refraction solution in real-time FEMME 2009 Lisbon, April 21-24
Conclusion (2) • Acoustic reconnaissance can help you pick your battles, such information allows us to understand • underlying causes of variability, • the temporal and spatial nature of that variability • …and to react accordingly • MVP, Acoustics and Uncertainty Wedge Analysis is a potent tool for MBES Survey REA • This type of information can help allocate resources such as MVP more intelligently and efficiently: work smarter, not harder FEMME 2009 Lisbon, April 21-24
Refraction doesn’t need to be a mysteryTHANK YOU!! FEMME 2009 Lisbon, April 21-24
Acknowledgements • NSERC and CFI funding of OMG • Sponsors of the UNB Chair in Ocean Mapping • Fugro Pelagos • Kongsberg Maritime • Rijkswaterstaat (Dutch Public Works) • Route Survey Office (Canadian Navy) • Royal (U.K.) Navy • U.S. Geological Survey FEMME 2009 Lisbon, April 21-24
FEMME 2009 Lisbon, April 21-24
Effect of Tilted Interfaces (2) FEMME 2009 Lisbon, April 21-24
MVP for REA (2) MVP 150° Single cast 150° Single cast 130° 250 m 900 m FEMME 2009 Lisbon, April 21-24
10 Saint John River Gorge, Nov. 2008, rising tide 20 Brackish Fresh Salt FEMME 2009 Lisbon, April 21-24