Download
1 / 20
200 likes | 203 Views
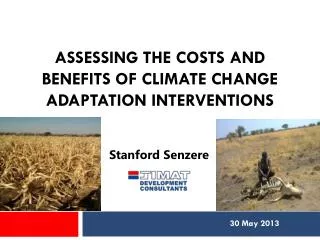
This lecture explores the use of hydro-economic models to estimate the costs and benefits of adapting to climate change in the water sector. It covers key economic principles, water supply and demand, and optimizing water allocations across uses and places.

E N D
Brian H. Hurd, PhD, ProfessorDept. of Agricultural Economics & Agricultural BusinessNew Mexico State University bhurd @ nmsu.edu http://agecon.nmsu.edu/bhurd Climate Change Adaptation in the Water Sector:Lec 3. Using Hydro-Economic Models to Estimate Water Use and Allocation Changes Water 水 agua น้ำaigua eau ura wasser vesi nướcνερό acqua baда पानीtubigనీరుதண்ணீர்ນ້ໍາ “Assessing Costs and Benefits of Adaptation: Methods and Data” First Regional Training Workshop – Capacity Building Programme on the Economics of Adaptation Bangkok, Thailand 11 Mar - 14 Mar 2013
Lec 3. Using Hydro-Economic Models to Estimate Adaptation Costs and Benefits of Water Use and Allocation Changes • Conceptual framework and key economic principles • Balancing water supply and demand • Optimizing water allocations across uses and places
REVIEW: Economy of Water Use • Water as a factor of production, and as a capital asset • Opportunity costs and ‘scarcity’ value • Static efficiency: managing surface water use • Equalizing marginal net benefits across space • Dynamic efficiency: Managing groundwater use • Equalizing marginal net benefits across time: • Inter-temporal tradeoffs and the concept of ‘user cost’ in efficient water pricing
D $ Economy of Water Use S Q • When less water is availability than is desired, scarcity exists and allocation decisions are required • Welfare is maximized when no single user can be made better off without harming another • When marginal net benefits are equal for all users • When marginal benefits equal marginal opportunity costs • Opportunity costs in this cases include: • Foregone value of resources used in supplying water that could have been used elsewhere (marginal cost) • Foregone value of water to other users (marginal scarcity cost) • Lesson 1: Single Sector Market • Lesson 2: Two Sector Market
Concepts of Value, Willingness to Pay and Demand Demand (marginal value)
Concepts of Cost, Opportunity Cost and Supply Supply (marginal cost)
Concepts of Cost, Benefit and Net Benefit Supply (marginal cost) Demand (marginal value)
Economic Efficiency:Single Sector Market $ g S a 0 b 1 h P* c D d i Q Q1 Q0 Q*
Efficient Allocations Across Users:Adding demand curves horizontally
$($/m3) P1 P0 Dtotal Q10 Q0 (normal) Qwater Q1 (drought) Economic Effect of ‘Drought’:Efficient Response in Two Sector Market Note: Illustrated demand curves are ‘net demand’ curves or ‘marginal net benefit’ curves – that is after all associated marginal costs (e.g., conveyance, treatment, distribution) have been subtracted. D1 Δ Welfare ($) 1 D2 0 Q20 Q11 Q21
Modeled Runoff and Allocation Changes in the Lower Colorado Basin
A. Key characteristics and properties of water • Water availability determines land suitability • Agriculture is the major water user (globally accounting for 70% of withdrawals) • Irrigation of crops greatly improves the productivity of land • Transforming available water into usable water is, in most cases, increasingly costly (both financially and environmentally) • Increases in the efficiency of water use can significantly ‘stretch’ the services generated by existing supplies
Water Use Profile: Selected Countries http://earthtrends.wri.org/text/index.php Based on AQUASTAT and other databases
Databases AQUASTAT AQUASTAT is FAO's global information system on water and agriculture. It collects, analyses and disseminates data and information by country and by region. Its aim is to provide users interested in global, regional and national analyses with comprehensive information related to water resources and agricultural water management across the world, with emphasis on countries in Africa, Asia, Latin America and the Caribbean. CropWat CROPWAT is a decision support system developed by the Land and Water Development Division of FAO. CROPWAT is meant as a practical tool to help agro-meteorologists, agronomists and irrigation engineers to carry out standard calculations for evapotranspiration and crop water use studies, and more specifically the design and management of irrigation schemes. Climwat Climwat is a climatic database to be used in combination with the computer program CROPWAT. It includes data from a total of 3262 meteorological stations from 144 countries. http://www.fao.org/nr/water/infores_databases.html
Measuring benefits and costs • Market measures of value • Available data or survey of Estimated market prices (costs) * Estimated quantities produced (used) • Estimation may require projections or forecasts of changes in produced goods and services, construction and operating costs, financing costs etc.
Measuring benefits and costs • Non-market measures of value • Benefits (damages) from other sources of value • For example, environmental quality changes, impacts on future generations, cultural or historic features, etc. • Data and Methods • Changes in property values, wages, health risks (hedonic methods) • Stated values from surveys (contingent valuation, conjoint analysis) • Observed recreation patterns (travel cost methods)
Merci’ Beaucoup! Grazie Gracias Thank You Brian H. Hurd, PhD Department of Agricultural Economics & Agricultural Business Gerald Thomas Hall Rm. 350 New Mexico State University Tel : (575) 646-2674 Email: bhurd@nmsu.edu Web: http://agecon.nmsu.edu/bhurd