Download
1 / 15
150 likes | 283 Views
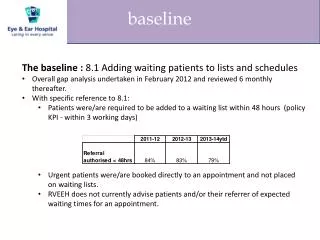
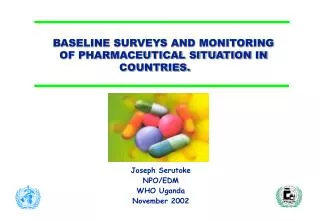
Baseline surveys. 16 page socioeconomic survey developed with staff from Harvard and J-PAL, piloted, refined by graduate students from Duke and Yale Applied to every single one of 2700 families in the 135 communities in the protected area

E N D
Baseline surveys • 16 page socioeconomic survey developed with staff from Harvard and J-PAL, piloted, refined by graduate students from Duke and Yale • Applied to every single one of 2700 families in the 135 communities in the protected area • Water quality (coliforms, signs of cattle grazing, turbidity dissolved oxygen, and temperature) measured above, in and below all 135 communities) • Amphibian and dung beetle diversity and abundance measure in the forests above each community
Phase 1: results of baselines returned to all 135 communities, damage caused by extensive cattle grazing and alternatives explained
Randomization to identify the 65 communities where we will intervene Stratified by municipality, community size, and cow numbers
Phase 2: explain the PES/ARA concept, offer the intervention: in-kind compensation packages • $10 per ha/year plus cattle exclusion inputs (within 100 m of streams, no cattle allowed) • $3 per ha/year (within 100 m of streams, cattle exclusion plan) • $1 per ha/year (away from streams, cattle exclusion plan)
Sign contracts (day 7)
ARA April-June 2012
Advances • Baseline survey and phase 1 completed: • baseline socioeconomic and biophysical results returned to all 135 communities • importance of conservation explained to all • randomization completed • Phase 2: Contracts signed with 284 families to protect 8716 ha in the 65 randomly-chosen communities • Phase 3: M&E will initiate in November 2012
Example: in Huantas, 8 families (5 led by women, 3 led by men) joined the program, signing contracts to conserve 160 ha, and receiving compensation packages of apple and plum tree seedlings and barbed wire worth a total of $1019.60. • 57 of the 65 eligible communities have community members enrolled in the scheme, 14 of these communities were new in 2012. • 375 hectares were contracted for conservation in 2011; 8340 additional hectares were contracted in 2012 (increase of 2124%)
Highlights • We’re flying blind on this • Figuring out how to measure impact is complex • Training ourselves and own technicians • Questioning our own beliefs • Making fundamental mistakes • No fundamental problems with RCT evaluation methodology for conservation • Relatively straightforward • Relatively cheap • Need cutting edge economic tools for RCT (Harvard, MIT J-PAL)