Download
1 / 19
190 likes | 307 Views
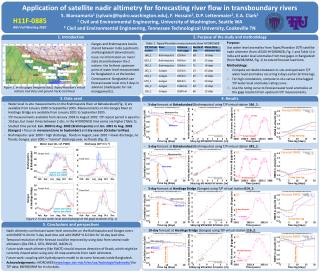
Upstream Satellite-derived Flow Signals for River Discharge Prediction. Tom Hopson 1 F. A. Hirpa 2 ; T. De Groeve 3 ; G. R. Brakenridge 4 ; M. Gebremichael 2 ; P. J. Restrepo 5. 1. 2 Uconn; 3 Joint Res Counc ; 4 U. of CO; 5 Office Hydro Devel. Outline.

E N D
Upstream Satellite-derived Flow Signals for River Discharge Prediction Tom Hopson1 F. A. Hirpa2; T. De Groeve3; G. R. Brakenridge4; M. Gebremichael2; P. J. Restrepo5 1 2Uconn; 3Joint Res Counc; 4U. of CO; 5Office Hydro Devel
Outline • Monitoring river flows using Satellite-based Passive-Microwave data • Case study: Bangladesh’s vulnerability to flooding • Estimating flood wave celerity • River discharge estimation “nowcasting” • Discharge forecasting • Future Work
Objective Monitoring of River Stage and Flow: Satellite-based Passive Microwave Radiometer • -- Advanced Microwave Scanning Radiometer - Earth Observing System (AMSR-E) & NASA TRMM • (Future: Global Precipitation Measurement System) • - Utilizing 36-37Ghz (unaffected by cloud) • - pixel size ~20km • - ~2day complete global coverage (night-time brightness temperatures) • - data range: 1997 to present Other Approaches: satellite altimeter-derived water level (and discharge derived through rating curve): e.g. Birkett, 1998; Alsdorfet al. 2000; Jung et al. 2010, Papa et al. 2010, Alsdorfet al. 2011, Biancamariaet al. 2011
One day of data collection (high latitudes revisited most frequently) => On average, global coverage 1-2 days
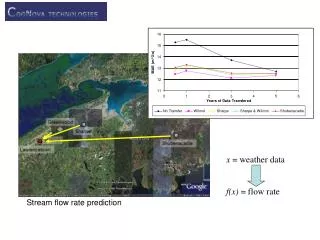
Example: Wabash River, Indiana, USA GDACS, JRC Gridded Approach Black square shows measurement pixel. White square is calibration pixel. De Groeve, et al, 2009, 2010 => Use “M/C” ratio Brakenridge, et al, 1998, 2005, 2007
Case Study: Bangladesh River Flooding Damaging Floods: large peak or extended duration Affect agriculture: early floods in May, late floods in September Recent severe flooding: 1974, 1987, 1988, 1997, 1998, 2000, 2004, and 2007 1998: 60% of country inundated for 3 months, 1000 killed, 40 million homeless, 10-20% total food production 2004: Brahmaputra floods killed 500 people, displaced 30 million, 40% of capitol city Dhaka under water 2007: Brahmaputra floods displaced over 20 million (World Food Program)
Bahadurabad gauge (Brahmaputra) Hardinge Bridge gauge (Ganges) Gauging data reference: Hopson 2005; Hopson and Webster 2010
Correlation vs. lag time and distance between Gage Q & satellite signals Ganges Brahmaputra
Estimating the kinematic wave celerity Ganges Brahmaputra Assumptions (large): hydraulic parameters homogenous; rainfall predominantly upper-catchment; wave speed variation with depth lower-order; dynamic wave effects lower-order (confirmed through rating curve analysis – not shown), etc. Independent analysis: Kleitz-Seddon Law for kinematic wave celerity c: W channel top-width, Q discharge, y the river stage. Brahmaputra at Bahadurabad: 4m/s < c < 8m/s; Ganges at Hardinge Bridge: 2m/s < c < 6m/s.
Generation of Nowcasts and Forecasts Regressor and model selection procedure: Correlate all variables with gauged observations Sort in decreasing level Select using step-wise forward-selection using K-fold cross-validation and RMSE cost function Repeat ii) – iii) for all lead-times
Discharge estimation “Nowcasting” Brahmaputra 2007 Ganges 2003
Skill Scores Nash-Sutcliffe efficiency (fraction of variance explained): -- 80% (1-day) to 55% (15-day) explained Now, generate a forecast including “persistence”: -- satellite information improves forecasts by 10-20% at all lead-times
Future Work Blend with ECMWF-derived forecasts (Hopson and Webster 2010; Operational in 2003) 2007 Brahmaputra Ensemble Forecasts and Danger Level Probabilities 7-10 day Ensemble Forecasts 7-10 day Danger Levels 7 day 8 day 7 day 8 day 9 day 10 day 9 day 10 day
Summary • Satellite-based passive microwave imagery useful tool for monitoring river conditions for limited-gauged basins • Useful for estimating: • -- flood wave celerity • -- discharge estimates (nowcasts) including filling in missing data • Combined with other methodologies, a potentially useful tool for flood forecasting of large river basins • Further questions: hopson@ucar.edu
MODIS sequence of 2006 Winter Flooding 2/24/2006 C/M: 1.004 3/15/2006 C/M: 1.029 3/22/2006 C/M: 1.095