Download
1 / 42
420 likes | 425 Views
A briefing report to the NCOP Select Committee on Economic and Foreign Affairs on the National Empowerment Fund (NEF) and its support for Black economic participation, wealth creation, and economic growth through access to capital.

E N D
Annual Report 2006/7 bridging the divide Briefing to the NCOP SELECT COMMITTEE ON ECONOMIC AND FOREIGN AFFAIRS: Support of Black Economic Participation, Wealth Creation and Economic Growth by means of Access to Capital. 21 November 2007 1
Presenters • Ms Philisiwe Buthelezi • Chief Executive Officer (CEO) • Mr. Andrew Wright • Chief Operating Officer (COO) • Ms. Maria Luke • Executive: Corporate Services • Mr. Nathan Nadasan • Manager: Post Investment 2
Mission Statement “The National Empowerment Fund (NEF) is the catalyst of broad-based Black Economic Empowermentin South Africa. We enable, develop, promote and implement innovative investment and transformation solutions to advance sustainable Black economic participation.” 3
NEF Mandate Main objective To be a catalyst in facilitating economic equality and transformation Driven by • Current market needs • Broad-based empowerment charters • Government policy and sectoral charters (Industrial Policy) • Addressing past failures of BEE structures • BB BEE Codes of Good Practice Development focus Maximise the empowerment dividend 4
BOARD OF TRUSTEES AUDIT COMMITTEE COMPLIANCE & RISK RISK MANAGEMENT COMMITTEE CHAIRMAN INTERNAL AUDIT HUMAN CAPITAL & REMUNERATION COMMITTEE CHIEF EXECUTIVE OFFICER CHIEF EXECUTIVE OFFICER SECRETARIAT BOARD INVESTMENT COMMITTEE EXECUTIVE COMMITTEE MANAGER: OFFICE OF THE CEO LEGAL COUNSEL CORE DIVISIONS CHIEF INVESTMENT OFFICER FUND MANAGEMENT EXECUTIVE: ASSET MANAGEMENT CHIEF FINANCIAL OFFICER CHIEF OPERATING OFFICER EXECUTIVE: HUMAN RESOURCES FINANCE STRATEGY & PLANNING HUMAN RESOURCES IMBEWU FUND BEE RETAIL INVESTMENTS MANAGEMENT OF SAIs RETAIL PRODUCT ISSUES MARKETING & COMMUNICATION SUPPORT SERVICES PROCUREMENT CORPORATE FUND PRE-INVESTMENT BUSINESS SUPPORT SYSTEMS & IT TREASURY POST-INVESTMENT BUSINESS SUPPORT Executive (member of Exco) Senior manager LEGAL SERVICES Manager Organisational Structure 5
Strategic Initiatives • NEF, IN 2006/7, reaches two significant and • strategic milestones in its history since its establishment: On-going track record achieved in the Fund Management Division, with approvals to date now exceeding R500m; Asset Management Division was able to obtain the overall approval for the NEF’s first BEE Retail Product, Asonge, subsequently launched on 25 June 2007. 6
Launched the successful Asonge Share Scheme to promote a culture of saving & investment among Black people 7
Asset Management Division • Through its Asset Management Division, the NEF: • Promotes the understanding of equity ownership among black people • Provides black people with direct and indirect opportunities to acquire shares in State Owned and private business enterprises • Encourages and promote investments, savings and meaningful economic participation amongst black people It is specifically to address the above objectives that the NEF Asonge Share Scheme was conceived, designed, launched, implemented, subscribed for and now allocated to its beneficiaries. 9
To promote the understanding of equity ownership among black people Rollout, Education and Mobilisation • 64 mobilisers were educated around the country • Mobilisers touched 10 000 groups and 150 000 individuals by one-on-one education efforts • Collaboration with Stokvel associations • Ongoing monitoring of education process by NEF before closure on 16 August • Further education around investing and financial markets was done through TV and radio, features and drama • A dedicated Call Centre assisted with all queries in all languages • Mass groups were reached by 9 regional road-shows; TV, local radio and print advertising; commuter activity, and activity at Post Offices nationally 10
Provide black people with direct and indirect opportunities to acquire shares in State Owned and private business enterprises State Allocated Investments: Recap • In November 2000, the Government provided for State Allocated Investments to be housed under custody of the NEF • The intention was for these to be eventually transferred to Black people • As a result the NEF since held 1,5% of the MTN Group’s shareholding • Asset Management Division developed a retail product known as the Asonge Share Scheme • Asonge was the NEF’s vehicle of fulfilling Government’s original intention of transferring State investments to Black people 11
Encourage and promote investments, savings and meaningful economic participation amongst black people “The NEF ASONGE Share Scheme” • 50% of the offer was aimed at black individuals (half had to be women) • 50% of the offer was aimed at black savings and investment groups • Predetermined allocation to the target audiences across all provinces • Applications were facilitated by the SA Post Office, ensuring wide distribution through their infrastructure • Offer opened on 23rd July and closed on 16th August • The Offer Price was set at R73,84 based on the market closing price … and as at 19 November 2007, this translated into a 69% appreciation on investment for subscribers at current market value based on: - the upfront 20% discount offered plus - current market price of R124.50 per share 12
Who was Eligible? • Allocation planned to be 50% for individuals and 50% for savings and investment groupings across South Africa. • Black individuals: • At least 18 years of age • With a valid South African ID • Bank account • Half had to be women • Minimum subscription was R2 000, maximum R50 000 • Black savings and investment groups • E.g. Stokvels, burial services, trusts, co-ops, church savings groups • Minimum subscription was R2 000, max R100 000 13
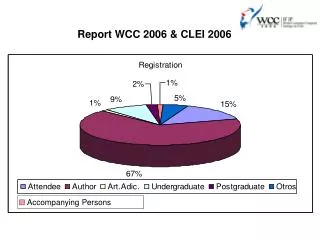
Province Allocation % Subscriptions Subscriptions % Over / Under Subs (-) Eastern Cape 13.5% R 35,283,118 4.0% -71% Free State 6.3% R 22,073,204 2.5% -60% Gauteng 21.5% R 434,221,613 48.8% 127% KwaZulu-Natal 21.4% R 191,039,774 21.5% 1% Limpopo 10.5% R 44,372,407 5.0% -52% Mpumalanga 7.3% R 33,205,804 3.7% -49% Northern Cape 2.2% R 7,495,183 0.8% -62% North West 7.5% R 29,947,841 3.4% -55% Western Cape 9.8% R 91,594,913 10.3% 5% 100.0% R 889,233,857 100.0% “The NEF Asonge Share Scheme” Subscriptions by Province • Allocations from undersubscribed provinces were transferred to oversubscribed provinces • Due to overwhelming interest shown in Asonge, the NEF has approved a further 1,376,058 shares for the share scheme worth R103 million to match the 13% oversubscription level. 18
“The NEF Asonge Share Scheme” Subscriptions by Province 19
“The NEF Asonge Share Scheme” Subscriptions by Province 20
Consolidated Allocation Results • 10 640 000 MTN shares, worth R1,14bn, were offered to qualifying investors plus one bonus share for every 10 held after 24 months • A further 1 376 058 shares, worth R147m, were allocated to accommodate oversubscriptions plus one bonus share for every 10 held after 24 months • Over 87 000 applications were received in total • Value of allocations = R890m vs. R1,3bn market value at allocation date All valid applications within the allocation value thresholds will receive the full allocation. 21
Consolidated Allocation Results • Groups allocated 9% of total value vs. 50% target It appears that investors preferred to invest as individuals as opposed to within groups who may have a limited investment horizon. • Of individual subscription by value, Female = 43% and Male = 57% • Geographical spread • 6 Under-subscribing provinces at between 49% - 71% of initial allocation • KZN and WC allocated 101% and 105% of initial allocation respectively 22
Exceptions • As with all subscription processes, certain applications were not valid or were rejected • The subscription value of such rejections was R2,508,463 • We also have many potential duplicate applications, potentially to the value of R7,216,166 • Each will have to be further analyzed on merit and a decision made to include or exclude them from the offer • These have been EXCLUDED from the share allocation model together with the SAPO rejections of R11,7 million 23
An Overall Success! • Asonge oversubscribed by 13% – meets existing public demand and sets an historic landmark for future share offers • Over 85 000 Black investors now own shares in a blue-chip company • Contributed to a growing culture of Savings and Investment amongst Black people • Women shareholders = 49% by number, 39% by value (overall), 51% by number and 43% by value (within individuals) In excess of targets set by BB BEE Codes of Good Practice • All provinces were allocated shares and involved in the marketing campaign to enable participation to their full capacity • Unencumbered economic benefit is fully vested in Black hands • Government fulfilling a critical national imperative through NEF 24
Fund Management Division On-going track record achieved in the Fund Management Division, with approvals to date now exceeding R500m. 25
38 worth R471m 29 worth R265m 16 worth R196m 86 worth R496m Approx. 24,685 4,780 Deal Pipeline: 31 March 2007 ENQUIRIES APPLICATIONS NEW DEALS ACCEPTED DUE DILIGENCE APPROVED DISBURSED (INCLUDING UNDRAWN CAPITAL) 26
NEF INVESTED PROCESS REPORT 31ST MARCH 2007 NEW DEALS ACCEPTED DUE DILIGENCE APPROVED DISBURSED TOTAL Since Inception to 31st March 2007 38 worth R471m 29 worth R265m 16 worth R196m 86 worth R496m 169 worth R1,428m iMbewu Fund 24 worth R126m 23 worth R143m 8 worth R34m 58 worth R97m 113 worth R400m Corporate Fund 14 worth R345m 16 worth R122m 8 worth R162m 28 worth R399m 56 worth R1,028m Fund Management Division 27
NEF INVESTED PORTFOLIO BY SIZE OF TRANSACTION 31ST MARCH 2007 (R) VALUE % BY VALUE BY NUMBER % BY NUMBER Greater than R5m R372m 75% 18 20.9% Less than R5m R124m 25% 68 79.1% R496m 100% 86 100% Fund Management Division 28
NEF INVESTED PORTFOLIO BY FUNDING PROJECT 31ST MARCH 2007 % BY VALUE BY NUMBER % BY NUMBER Acquisition Funding Capital Market Start-Up Liquidity & Warehousing Expansion Contracts Rural & Community R237m R74m R64m R60m R40m R20m R1m 47.7% 14.9% 12.9% 12.1% 8.1% 4.0% 0.3% 12 4 42 3 18 6 1 14.0% 4.7% 48.8% 3.5% 20.9% 7.0% 1.1% R496m 100% 86 100% Fund Management Division 29
Start-up 12.9% Acquisition Funding 47.7% Rural & Community 0.3% Liquidity & Warehousing 12.1% Expansion 8.1% Contracts 4% Capital Market 14.9% Fund Management Division NEF – Invested portfolio by funding product by value 31st March 2007 30
Rural & Community 1.3% Liquidity & Warehousing 3.5% Start-up 48.8% Expansion 20.9% Contracts 7% Capital Market 4.7% Acquisition Funding 14% Fund Management Division NEF – Invested portfolio by funding product by number 31st March 2007 31
CCT NEF IDC TECHNICAL PARTNER CR R14,8m R19,4m AMAJUBA R37m A Sweet Deal! • 60 HA raspberry farm in Amajuba district, KZN • Farm established on land secured through restitution process • Community beneficiaries with CCT governed by 11 trustees • Project taps into 482 000ha worldwide market • SA production only 100 ha currently • Project will be leading local supplier at full capacity • Supply local and export markets (70% of production) • Tap into growing popularity of raspberries 33
Compliance with R&CD product criteria • Broad based community ownership • Sustainable projects with strong social benefits • Strong technical partners • Skills transfer • Poverty alleviation • Strong empowerment dividend • Broad based economic ownership (1100 beneficiaries) • Job creation (795 jobs including 91 permanent) • Women empowerment ( 60% of workforce) • Project location – rural KZN area • Local Economic benefits • Contribution of R9.8 m pa in salaries to local economy • Electrification of houses • Provision of land for new houses • Partnership with IDC • Leveraging IDC sector knowledge • Contributing NEF know-how in financing rural communities 34
JOB CREATION 31ST MARCH 2007 RAND INVESTED NUMBER OF JOBS EXISTING JOBS NEW JOBS RAND PER JOB Start-Up Expansion Acquisition Funding Contracts Rural & Community Capital Market Liquidity & Warehousing R64,2m R40,1m R236,7m R19,8m R1,4m R73,8m R60m 817 784 2,519 500 12 3,930 542 3 279 1,492 210 0 3,830 362 814 505 1,027 290 12 100 180 R78,5k R51,2k R93,9k R39,6k R120,8k R18,8k R110,7k TOTAL PORTFOLIO: R496m 9,104 6,176 2928 R54,5k 68% 32% Average Fund Management Division 35
Wood & Paper Industry 2.9% Chemicals & Pharmaceuticals 6.7% Other 0.5% Transportation 1.3% Construction 23.1% Tourism & Entertainment 9.4% Textile Industry 2.3% Engineering 2% Printing Services 3.1% Financial Services 1.5% Motor Industry 2.2% Food & Agro Processing 11% Mining Services 9.2% Manufacturing 9.1% Financial Services 1.5% ICT & Media 15.2% Fund Management Division NEF – Invested portfolio by sector by value 31st March 2007 36
NEF INVESTED PORTFOLIO BY REGION 31ST MARCH 2007 % VALUE PROVINCE CONTRIBUTION TO GDP (R) VALUE % BY VALUE BY NUMBER % BY NUMBER Gauteng Eastern Cape Western Cape Kwa-Zulu Natal Mpumalanga Limpopo Free State Northern Cape North West R227,6m R108,2m R95,5m R34,9m R26,7m R2,8m R0,3m - - 54.9% 21.8% 19.3% 7% 5.4% 0.6% 0.1% 0% 0% 50 8 14 8 2 3 1 0 0 58.1% 9.3% 16.3% 9.3% 2.3% 3.5% 1.2% 0% 0% 33.7% 7.9% 14.7% 16.3% 6.7% 6.7% 5.5% 2.2% 6.3% R496m 100% 86 100% 100% Fund Management Division 37
With effect from October 2007, NEF to launch Provincial Roundtables with stakeholders in the following provinces: • KZN • North West • Limpopo • Objective is to optimise regional invested portfolio through intensive local interaction and communication • Stakeholders will include: • Premiers, MECs for Finance & Economic Affairs, as well as MECs for Agriculture, to encourage rural and community development • Constituency Members of Parliament • Local Development Finance Institutions (DFIs) • Local entrepreneurs and co-operatives • Mass Media • Mpumalanga • Northern Cape • Free State Provincial Roundtables 38
Annual Financial Statements 39
2007 Consolidated 2006 R’ 000s R’ 000s Consolidated Statement of Financial Position as at 31st March 2007 Non-current Assets Property & Equipment Intangible Assets Investment in Joint Venture Investment in Associates Investments available-for-sale Originated Loans Investments held-to-maturity Capital & Reserves Trust Capital Fair Value Reserves Accumulated Surplus 2,669,406 2,296 125 - 24,317 2,303,924 338,744 - 3,551,018 1,233,903 2,219,908 187,207 1,615,442 2,777 194 - 5,407 1,444,022 15,042 10,000 2,087,339 740,600 1,270,006 76,732 40
Consolidated 2007 2006 R’ 000s R’ 000s Consolidated Statement of Financial Performance as at 31st March 2007 Revenue Grants Received to fund Operations Grants Received for Retail Prod. Development Dividends from Investments Interest Received from Banks Interest Received from Original Loans Other Revenue Other Income Fair Value Gains/Losses Held-for-trade Investments Investments in Associates Total Income Administration Expenses Impairment of Originated Loans Impairment – Held-to-maturity Investments Surplus for the Year 170,785 66,.24 1,800 30,411 43,643 27,152 1,755 - 30,666 12,352 17,714 200,851 (62,385) (26,491) (14,936) (11,555) 111,975 105,370 40,000 - 38,405 23,197 3,501 267 6 16,882 21,476 (4,594) 122,258 (40,633) (38,151) (38,151) - 43,474 41
We thank you for your attention. www.nefcorp.co.za 42