Download
1 / 31
310 likes | 316 Views
Teaching Geoscience with Data, Models, and Visualizations. Paul Hoskin Summer 2007. Exercise:.

E N D
Teaching Geoscience with Data, Models, and Visualizations Paul Hoskin Summer 2007
Exercise: • Sketch a diagram (visualization) of the following text:“A supposed equality existing in vertical sections of the earth, whereby the weight of any column from the surface of the earth to a constant depth is approximately the same as that of any other column of equal area, the equilibrium being maintained by plastic flow of material from one part of the earth to another.” [NASA.gov]
A supposed equality existing in vertical sections of the earth, whereby the weight of any column from the surface of the earth to a constant depth is approximately the same as that of any other column of equal area, the equilibrium being maintained by plastic flow of material from one part of the earth to another. • NASA.gov
A state of equilibrium, resembling flotation, in which segments of Earth's crust float (on liquid mantle material) at levels determined by their thickness and density. Isostatic equilibrium is attained by flow of material in the mantle. • isu.edu Modeling tool from umich.edu
The equilibrium maintained between the gravity tending to depress and the buoyancy tending to raise a given segment of the lithosphere as it floats above the asthenosphere. • mit.edu Modeling tool from umich.edu
Visualizations Tell Stories • Mantle is molten. • If it is not molten, where does magma come from? How does the mantle convect? • Mid-ocean ridges are locations of underwater volcanoes. • Where do the volcanoes go as the plate moves away from the ridge? • Magma is stored in large open chambers in the crust; flows to fill in open spaces. • If there are no magma “chambers” how do we create giant batholiths? • Students visualize the objects but not the process.
Flow in the (Fluid?) Mantle • Conveyor-belt flow model with no sense of time
How is oceanic lithosphere formed? • Complete melting beneath ridges • No labeling of layers • No temperature or density information
Magma fills empty spaces? • Magma intrusions causing no metamorphism of surrounding area • The space problem is poorly addressed
What causes confusion? • Metaphors, analogies and models that get merged with incorrect or incomplete current and prior understandings? • Ineffective / incomplete graphics? • Poor spatial skills? • All of the above.
Visualizations improve learning when they … • Incorporate learner controlled manipulation of real or computer simulated models • Direct the learner to observe effects of changes in an objects orientation on its 2D image. • Encourage hypothesis testing about 2D and 3D objects • Require externalizing mental images • Provide practice in mentally rotating an object • Encourage visualizing the interior of bodies • Lord, 1985; Ben-Chaim et al, 1988; Duesbury and O’Neil, 1996; Kali and Orion, 1997
Thinking about YOUR teaching… • Simple viewing of visualizations is passive learning and likely no more effective than passive listening to a lecture. • So, what can you as a teacher do about this?
Let’s look at some descriptions: • Visualization:– use of images, animations, cartoons, schematics, and block-models (e.g., ball-and-stick mineral structures). • Models:– numerical and/or graphical simulation of a process or phenomenon.– an idealization that embodies certain aspects of the “real thing” that are of interest. (Priscilla Laws, Workshop Physics) • Data:– information derived from measurement or observation (including “synthetic” information derived from numerical simulations/models) [See Manduca & Mogk, 2002, for full discussion].
Resources to use when preparing your lectures and labs: • Teaching Geoscience with Visualizations (http://serc.carleton.edu/NAGTWorkshops/visualization/index.html) • Teaching with Data (http://serc.carleton.edu/introgeo/teachingwdata/index.html) • How to Use Models (http://serc.carleton.edu/introgeo/models/HowToUse.html)
Learning with Data Workshop (http://lwd.earthednet.org AND http://earthednet.org/) • Web-based databases (e.g., NAVDAT: The North American Volcanic and Intrusive Rock Database: http://navdat.kgs.ku.edu/) • A good number of other NSF-funded web-sites [usually with loose pedagogical descriptions and good to poor resources for in class use]. An example:
Pedagogical Rationale • 99.9% of Earth is inaccessible for direct observation, so visualizations are essential; temporal and spatial scales cannot easily be simulated in the lab, so visualizations are essential. • Data-enhanced learning experiences, including activities in which students collect and interpret their own data AND in which they explore research databases to answer questions, are important tools for their learning. • In short:– using data improves learning about science– using data fosters inquiry and active learning– can easily tailor lectures/labs to be relevant and meaningful (e.g., global warming, Mars mineralogy, seismic hazards; see lead articles of EOS)
Example: teaching with a model • Darcy’s Law: development of a numerical model • Set-up: in-lecture discussion may be proceeded by a demonstration where students are asked to make predictions prior to observing a physical model operate. • Aim: to gently lead a math-phobic class to formulate (and later test/verify) Darcy’s Law. • Method: using the black-box approach
Step 1a: describe a “real world” scenario • Step 1b: sketch a physical model and label
Step 2: identity where the black-boxes go and start to describe (hint: in this case it is useful to have the class identity the units of the output black-box [flow rate volume per unit time])
Step 4: do “mind experiments” to have the class make predictions using the formula for testing in an associate laboratory.
The Advantages of Models • Is interactive • Can introduce specific content and terminology • Can be used to explore “what if” scenarios • Can be used to explore the sensitivity of a system to value changes of specific variables.
Thinking about YOUR teaching… • As a teacher (1) what would you have done to teach that example better; (2) what two specific examples relevant to your sub-discipline could you use in a lecture?
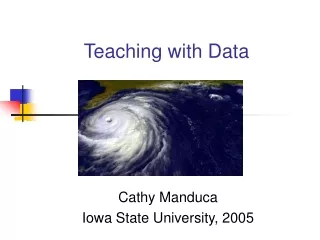
Example: teaching with data • The modern CO2 record(a shortened and refocused example modified from: http://serc.carleton.edu/introgeo/teachingwdata/examples/ModernCO2.html) • For in-lecture use (e.g., a freshman-level physical geology lecture). • The exercise would follow a discussion on what the class already know about greenhouse gases and global warming. • Aim: (i) to become familiar with atmospheric CO2 fluctuations at Mauna Loa, Hawai’i; (ii) to understand what processes might explain the long-term trend in atmos. CO2 conentration; (iii) to get a feeling for data “quality” and predictions based on such data.
Step 1: student groups are given selected data to plot (specific instructions are given on the axis labels, intervals, and limits) • Step 2: students are asked to describe their plots and make two observations; these are discussed as a class • Step 3: the whole dataset is pieced together step-by-step
Step 4: the class is given a copy of the plot and again asked to make two observations. The observations are discussed. • Step 5: the class is told that once the 460 ppmw CO2 threshold is crossed, the Earth will experience regular catastrophic weather changes and will have passed the point of no return. They are instructed to draw a line of best-fit through the data and (i) calculate the rate of CO2 accumulation per year over the period of 1975 to 2000; (ii) estimate when we will reach the 460 ppmw threshold. Two things can then be discussed: how to draw a line of best-fit and if such an approach is valid, and what the range of estimates means (there will be a range of estimates).
Thinking about YOUR teaching… • (i) Do you think such an exercise is useful and if so, what will you do to make sure that all class members are engaged and contributing? (ii) What dataset might you use in a lower-division class? Upper-division class?
Acknowledgements • Michelle Hall-Wallace, Uni. Arizona