Download
1 / 39
400 likes | 778 Views
15.1 Venn Diagrams. 15.1 Venn Diagrams. Objectives : Use Venn Diagrams to find union, intersection and complement. Create Venn Diagrams Use Venn Diagrams to solve real life problems Vocabulary : Venn Diagram, Union, Intersection, Complement. VOCAB:

E N D
15.1 Venn Diagrams Objectives: • Use Venn Diagrams to find union, intersection and complement. • Create Venn Diagrams • Use Venn Diagrams to solve real life problems Vocabulary: Venn Diagram, Union, Intersection, Complement
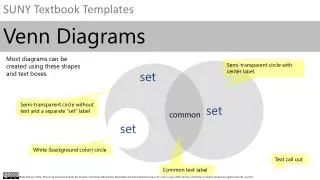
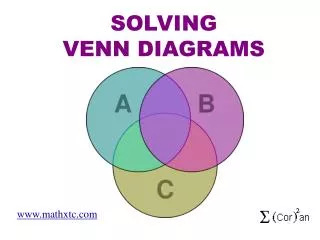
VOCAB: A Venn diagram is a diagram that uses circles to illustrate the relationships among sets. Venn diagrams were invented by John Venn as a way of picturing relationships between different groups of things. Since the mathematical term for "a group of things" is "a set", Venn diagrams can be used to illustrate both set relationships and logical relationships.
Given the Venn Diagram: Let A be the set containing the numbers 1 and 2; Our set notation would be A = {1, 2}. Let B be the set containing the numbers 2 and 3; Our set notation would be B = {2, 3}.
Given the venn diagram, find: AA BA A U C 53 ~ C 66 (B∩C ) – A 6 CA
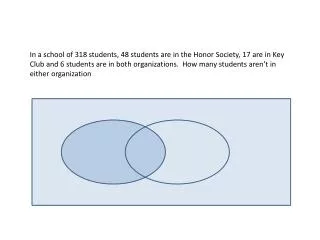
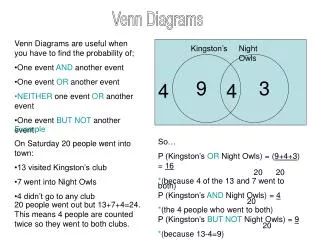
Out of forty students, 14 are taking English Composition and 29 are taking Chemistry. If five students are in both classes, how many students are in neither class? How many are in either class? What is the probability that a randomly-chosen student from this group is taking only the Chemistry class?
Ms. Pobuda discovered that her cat liked eating geckoes. By the end of one month, she had the following: six gray geckoes, twelve geckoes that had dropped their tails in an effort to escape capture, and fifteen geckoes that he'd chewed on a little. Only one of the geckoes was gray, chewed on, and tailless; two were gray and tailless but not chewed on; two were gray and chewed on but not tailless. If there were a total of 24 geckoes that month, and all of the geckoes were at least one of "gray", "tailless", and "chewed on", how many were tailless and chewed on but not gray? Three geckoes were tailless and chewed on but not gray
Restaurants Fill in the Venn Diagram that would represent this data. 100 people seated at different tables in a Mexican restaurant were asked if their party had ordered any of the following items: margaritas, chili con queso, or quesadillas 23 people had ordered none of these items. 11 people had ordered all three of these items. 29 people had ordered chili con queso or quesadillas but did not order margaritas. 41 people had ordered quesadillas. 46 people had ordered at least two of these items. 13 people had ordered margaritas and quesadillas but had not ordered chili con queso. 26 people had ordered margaritas and chili con queso.
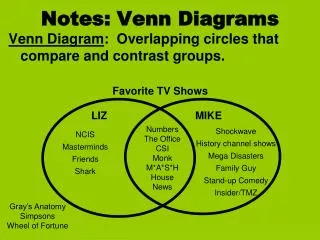
Cartoons Fill in the Venn Diagram that would represent this data. • A study was made of 200 students to determine what TV shows they watch. • 22 students don't watch these cartoons. • 73 students watch only Tiny Toons. • 136 students watch Tiny Toons. • 14 students watch only Animaniacs and Pinky & the Brain. • 31 students watch only Tiny Toons and Pinky & the Brain. • 63 students watch Animaniacs. • 113 students do not watch Pinky & the Brain
Concert Fill in the Venn Diagram that would represent this data. 150 people at a Van Halen concert were asked if they knew how to play piano, drums or guitar. 18 people could play none of these instruments. 10 people could play all three of these instruments. 77 people could play drums or guitar but could not play piano. 73 people could play guitar. 49 people could play at least two of these instruments. 13 people could play piano and guitar but could not play drums. 21 people could play piano and drums.
Star Trek Fill in the Venn Diagram that would represent this data. study was made of 200 students to determine what TV shows they watch. 22 students hated all Star Trek shows. 73 students watch only The Next Generation (TNG). 136 students watch TNG. 14 students watch only Deep Space 9 (DS9) and Voyager (VOY). 31 students watch only TNG and VOY. 63 students watch DS9. 135 students do not watch VOY.
Mythology Fill in the Venn Diagram that would represent this data. 100 people were asked if they knew who any of the following are: Loki, Hermes, and Ra. 25 people did not know any of these. 3 people knew all three. 48 people knew who Hermes or Ra were but did not know who Loki was. 40 people knew who Ra was. 21 people knew who at least two of these were. 7 people knew who Loki and Ra were but did not know who Hermes was. 8 people knew who Loki and Hermes were.
Pollutants Fill in the Venn Diagram that would represent this data. A study was made of 1000 rivers to determine what pollutants were in them.\\ 177 rivers were clean 101 rivers were polluted only with crude oil 439 rivers were polluted with phosphates. 72 rivers were polluted with sulfur compound and crude oil, but not with phosphates. 289 rivers were polluted with phosphates, but not with crude oil. 463 rivers were polluted with sulfur compounds. 137 rivers were polluted with only phosphates.
Tennis Strokes Fill in the Venn Diagram that would represent this data. 200 tennis players were asked which of these strokes they considered their weakest stroke(s): the serve, the backhand, the forehand. 20 players said none of these were their weakest stroke. 30 players said all three of these were their weakest stroke. 40 players said their serve and forehand were their weakest strokes. 40 players said that only their serve and backhand were their weakest strokes. 15 players said that their forehand but not their backhand was their weakest stroke. 52 players said that only their backhand was their weakest stroke. 115 players said their serve was their weakest stroke.
Tennis Tournaments Fill in the Venn Diagram that would represent this data. 200 people were asked which of these grand slam tournaments that they have attended. The tournaments inquired about were: US Open, Wimbledon, or Australian Open. 30 people have not attended any of these tournaments. 10 people have been to all thee tournaments. 25 people have been to Wimbledon and the Australian Open. 20 people have been to the US Open and the Australian Open but not to Wimbledon. 65 people have been to exactly two of the tournaments. 165 people have been to the US Open or to Wimbledon. 120 people have been to Wimbledon or to the Australian Open.
Models Fill in the Venn Diagram that would represent this data. 74 models were hired for the spring shows at a certain Paris design house and the following information about their body piercing was compiled. Note: Ears count as one piercing. Among the models with pierced ears combined with another body piercing, half the difference between all three parts pierced and only ears and nose pierced have only their ears and tongue pierced. There are 10 models who had all three parts pierced. 18 models have multiple piercings. All but 5 models have pierced ears. No model has pierced her nose or her tongue without piercing her ears as well, but one pierced both her nose and her tongue without piercing her ears.
The first statement gives that .5(e-b) = d or this can be written as e- b = 2d • The second statement says that e = 10 • The third statement says that e + b + d+ f = 18 • The fourth statement says that h + g + f + c = 5 it also says that a + b + e + d = 69 • The last statement gives the following information. • g = 0 • f = 1 • c = 0
Languages Fill in the Venn Diagram that would represent this data. There are 208 student at Irion County High School. The foreign language department offers French, German, and Spanish. 4 students take all three languages. 48 students study French. There are twice as many students who study both French and Spanish (but not German) as who study both French and German (but not Spanish), and 4 times as many as who study all 3. 124 students study Spanish. 27 poor misguided souls do not study any foreign language. The group of students who study both French and Spanish (but not German) is exactly the same size as the group made up of students who study both German and Spanish.
From the first and fifth statement, I have filled in the above numbers
The second statement gives: d + e + f + 4 = 48 The third statement gives two different equations: d = 2 e and d = 4 (4) = 16 The fourth statement gives: a + b + d + 4 = 124 The sixth statement gives: d = 4 + b Remember that the total number of students is 208
ASSIGNMENT • Page 568 Class Exercises #1-7 odd Written Exercises #11, 19