Download
1 / 1
10 likes | 129 Views
Discounted Total QALYs (DTQ): Mean total discounted QALYs for this and all subsequent generations of the population.

E N D
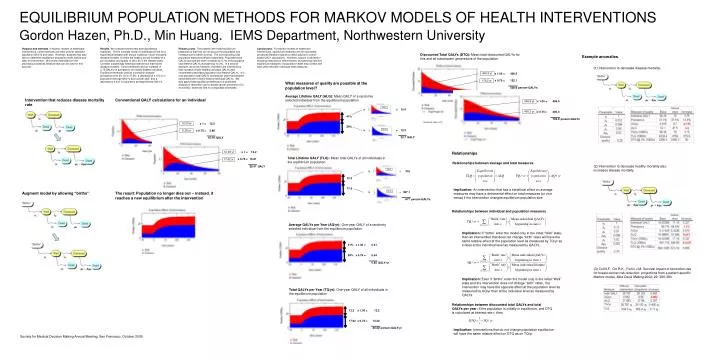
Discounted Total QALYs (DTQ): Mean total discounted QALYs for this and all subsequent generations of the population. Purpose and methods. In Markov models of healthcare interventions, cohort methods are often used to calculate population QALYs and costs. However, analysts may also wish to determine equilibrium population levels before and after an intervention. We review methods from the stochastic processes literature that can be used for this purpose. Results. We consider several real and hypothetical examples. One is a simple model of individuals at risk for a hypothetical disease with annual incidence 12 per thousand, disease mortality 10 times the healthy annual mortality of 4 per thousand, and quality of life 0.20 in the disease state. Consider a seemingly beneficial intervention that halves disease mortality. Cohort methods yield an increase of 3.75 QALYs on average for an initially healthy individual. Equilibrium methods yield an increase in disease prevalence from 23.1% to 37.5%, a decrease of 0.115 yr in population average QALYs accrued per year, and a decrease of 4.6 yr in population average lifetime QALYs. Results (cont). The problem with these equilibrium measures is that they do not account for population size increase due to better survival. The corresponding total population measures behave reasonably: Population total QALYs accruedper year increases by 5.7% and population total lifetime QALYs increases by 12.2%. In a second example, we show, however, that there are interventions that increase initially-healthy individual QALYs and nevertheless decrease population total lifetime QALYs. It is only population total QALYs accrued per year that behaves consistently with initially-healthy individual QALYs. We also apply these equilibrium methods to a published analysis of tamoxifen use for breast cancer prevention (Col et al 2002), where we find no comparable anomalies. Conclusions. For Markov models of healthcare interventions, equilibrium methods from the stochastic processes literature may be a useful adjunct to cohort-based QALY calculations. However, caution is advised in choosing measures of effectiveness, as seemingly intuitive equilibrium measures of population health may conflict with each other and with individual-level measures. Average Lifetime QALY (ALQ): Mean QALY of a randomly selected individual from the equilibrium population Discount rate = 3% Relationships between average and total measures Total Lifetime QALY (TLQ): Mean total QALYs of all individuals in the equilibrium population. Implication: An intervention that has a beneficial effect on average measures may have a detrimental effect on total measures (or vice versa) if the intervention changes equilibrium population size. Relationships between individual and population measures Implication: If “births” enter the model only in the initial “Well” state, then an intervention that does not change “birth” rates will have the same relative effect at the population level as measured by TQ/yr as it does at the individual level as measured by QALYs. Average QALYs per Year (AQ/yr): One-year QALY of a randomly selected individual from the equilibrium population Implication: Even if “births” enter the model only in the initial “Well” state and the intervention does not change “birth” rates, the intervention may have the opposite effect at the population level as measured by AQ/yr than at the individual level as measured by QALYs. Total QALYs per Year (TQ/yr): One-year QALY of all individuals in the equilibrium population Relationships between discounted total QALYs and total QALYs per year: If the population is initially in equilibrium, and DTQ is calculated at interest rate r, then Implication: Interventions that do not change population equilibrium will have the same relative effect on DTQ as on TQ/yr. Example anomalies. EQUILIBRIUM POPULATION METHODS FOR MARKOV MODELS OF HEALTH INTERVENTIONSGordon Hazen, Ph.D., Min Huang. IEMS Department, Northwestern University (1) Intervention to decrease disease mortality. What measures of quality are possible at the population level? Intervention that reduces disease mortality rate Conventional QALY calculations for an individual Relationships (2) Intervention to decrease healthy mortality also increases disease mortality. Augment model by allowing “births” The result: Population no longer dies out – instead, it reaches a new equilibrium after the intervention (3) Col N.F., Orr R.K., Fortin J.M. Survival impact of tamoxifen use for breast cancer risk reduction: projections from a patient-specific Markov model, Med Decis Making 2002; 22: 386-393. Society for Medical Decision Making Annual Meeting, San Francisco, October 2005