Download
1 / 35

E N D
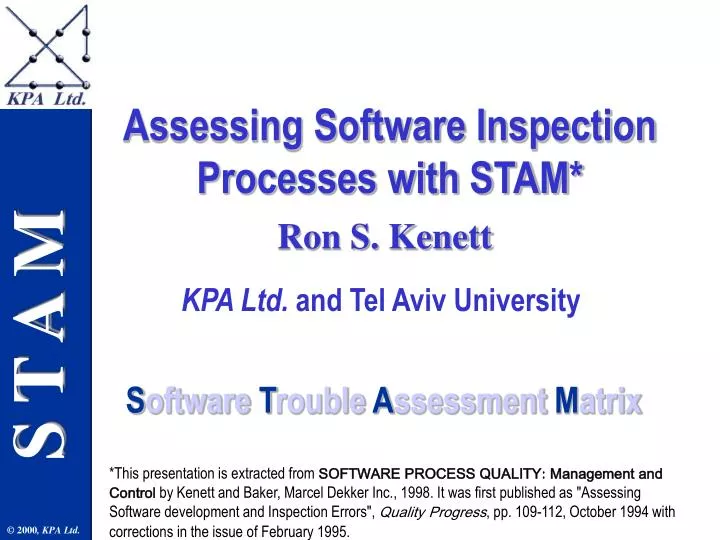
Software Trouble Assessment Matrix*This presentation is extracted from SOFTWARE PROCESS QUALITY: Management and Control by Kenett and Baker, Marcel Dekker Inc., 1998. It was first published as "Assessing Software development and Inspection Errors", Quality Progress, pp. 109-112, October 1994 with corrections in the issue of February 1995. Assessing Software Inspection Processes with STAM* Ron S. Kenett KPA Ltd. and Tel Aviv University
Presentation agenda • Software life cycles • Inspection processes • Measurement programs • Assessing software inspection processes
Presentation agenda • Software life cycles • Inspection processes • Measurement programs • Assessing software inspection processes
Informal software life cycle Marketing Requirements Spec Acceptance Test Spec System Test Spec System Requirements Spec System Design Spec System Integration Spec Software Requirements Spec Software Test Spec Design and Construction Artifacts
Test a little ... Design a little ... Implement a little ... Web applications life cycle
Change to Requirements? Change to Requirements? Change to Requirements? Requirements stage (Program Statement) Definition Gather initial requirements, clarify requirements for understanding (Draft Requirements Specification) Analysis Analyze requirements, categorizeto expose incomplete areas, and prioritize by importance (Requirements Specification) Proposal and Project Planning Proposal stage Develop Proposal and Project Plans to fulfill project requirements (Proposal) Formal software life cycle (Project Plans) Design stage Change Control (Functional Description) Update all related documents, code, and tests to reflect the change (Design) Code stage (Code and Unit Test) (Documentation) Verification stage (Technical Testing) (System Testing) END
Software Life Cycle Phases Requirements Analysis Top Level Design Detailed Design Acceptance Tests System Tests Unit Tests Program-ming
Presentation agenda • Software life cycles • Inspection processes • Measurement programs • Assessing software inspection processes
The software development matrix Work Products Work Product Control Practices Key Activities Work Product Development Practices Inspection Practices
Depends entirely on individuals. None Initial Policies, procedures, experience base Writing-Task Rules, QA Policies, Inspection Procedures Repeatable Defined processes, peer reviews Defined Defect removal, Entry, Exit Quantitative goals for product & process Optimum rates, quality level at exit & entry, data summary, d-base Managed Entire organization. focused on continuous process improvement Defect Prevention Process Improvements logging, Owners, Proc. Change Mgt. Team Optimizing SEI Capability Maturity Model Maturity Level Characteristics Software Inspection Features Based on Paulk et al, “Capability Maturity Model Version 1.1”, IEEE Software, July 1993.
Presentation agenda • Software life cycles • Inspection processes • Measurement programs • Assessing software inspection processes
Measurement Program Implementation:Plan/Evaluate Phase • 4.5.1 Plan/Evaluate Phase • 4.5.1.1 Reasons for implementation • Establish a baseline from which to determine trends • Quantify how much was delivered in terms the client understands • Help in estimating and planning projects • Compare the effectiveness and efficiency of current processes, tools, and techniques • Identify and proliferate best practices • Identify and implement changes that will result in productivity, quality, and cost improvements • Establish an ongoing program for continuous improvement • Quantitatively prove the success of improvement initiatives • Establish better communication with customers • Manage budgets for software development more effectively
Measurement Program Implementation:Plan/Evaluate Phase • 4.5.1 Plan/Evaluate Phase • 4.5.1.2 Questions to help identify goals • How fast can we deliver reliable software to our customers? Does it satisfy their requirements? • Can we efficiently estimate the development cost and schedule? Are the estimates accurate? • What can we do to improve our systems-development life cycle and shorten the cycle time? • What is the quality of the software we deliver? Has it improved with the introduction of new tools or techniques? • How much are we spending to support existing software? Why does one system cost more than another to support? • Which systems should be re-engineered or replaced? When? • Should we buy or build new software systems? • Are we becoming more effective and efficient at software development? Why? Why not? • How can we better leverage our information technology? • Has our investment in a particular technology increased our productivity?
Measurement Program Implementation:Plan/Evaluate Phase • 4.5.1 Plan/Evaluate Phase • 4.5.1.3 Identification of sponsors • 4.5.1.4 Identification of roles and responsibilities • Who will decide what, how, and when to collect the measurement information? • Who will be responsible for collecting the measurement information? • How will the data be collected? What standards (internal or external) will be used? • At which phases will the data be collected? Where will it be stored? • Who will ensure consistency of data reporting and collection? • Who will input and maintain the measurement information? • Who will report measurement results? When? • What will be reported to each level of management? • Who will interpret and apply the measurement results? • Who is responsible for training? • Who will maintain an active interest in the measurement program to ensure full usage of the measurement information? • Who will evaluate measurement results and improve the measurement program? • Who will ensure adequate funding support?
Measurement Program Implementation:Analysis/Implementation/Improve Phases • 4.5.2 Analysis Phase • 4.5.2.1 Analysis of audience and identification of target metrics • 4.5.2.2 Definition of Software Metrics • 4.5.3 Implement/Measure Phase • 4.5.3.1 Organizing for Just In Time training and education processes • 4.5.3.2 Reporting and publishing results • 4.5.4 Improve Phase • 4.5.4.1 Managing expectations • 4.5.4.2 Managing with metrics
Statistics from formal assessments“the tip of the iceberg” Source: SEI, 1994, number of organizations: 261 1997, number of organizations 606
REPEATABLE • Requirements Management • Project Planning • Project Tracking & Oversight • Subcontract Management • Quality Assurance • Configuration Management INITIAL Most organizations are moving towards level 2
Software Quality Assurance Requirements Management SoftwareProjectPlanning Software Configuration Management SoftwareProject Tracking and Oversight Software Subcontract Management CMM Level 2 Key Process Areas
Software Development Management Dashboard“it works only for organizations above level 2” PP and PTO PP and PTO RM QA CM
Presentation agenda • Software life cycles • Inspection processes • Measurement programs • Assessing software inspection processes
Software Trouble Assessment Matrix • When were errors detected? Depends on the inspection process efficiency - i.e., how it performs • When errors could have been detected? Depends on the inspection process effectiveness - i.e., how it was designed • When were errors created? Depends on the overall performance of the software development process
Software Life Cycle Phases Requirements Analysis Top Level Design Detailed Design Acceptance Tests System Tests Unit Tests Program-ming
When were errors detected? 7 3 Requirements Analysis Top Level Design Detailed Design 13 Acceptance Tests 2 29 25 31 System Tests Unit Tests Program-ming
When were errors detected? Life Cycle Phase Number of Errors Requirements Analysis 3 Top Level design 7 Detailed Design 2 Programming 25 Unit Tests 31 System Tests 29 Acceptance Test 13 Cumulative profile = S1
When errors could have been detected? Life Cycle Phase Number of Errors Requirements Analysis 8 Top Level design 14 Detailed Design 10 Programming 39 Unit Tests 8 System Tests 26 Acceptance Test 5 Cumulative profile = S2
When were errors created? Life Cycle Phase Number of Errors Requirements Analysis 34 Top Level design 22 Detailed Design 17 Programming 27 Unit Tests 5 System Tests 5 Acceptance Test 0 Cumulative profile = S3
The Software Trouble Assessment Matrix When were errors created? When were errors detected?
The Software Trouble Assessment Matrix When were errors created? When were errors detected?
Definition of STAM Metrics Negligence ratio:indicates the amount of errors that escaped through the inspection process filters. INSPECTION EFFICIENCY Evaluation ratio:measures the delay of the inspection process in identifying errors relative to the phase in which they occurred. INSPECTION EFFECTIVENESS • Prevention ratio:an index of how early errors • are detected in the development life cycle relative • to the total number of reported errors. • DEVELOPMENT PROCESS EXECUTION
Computation of STAM Metrics • Areas under cumulative profiles: • S1 = 337 • S2 = 427 • S3 = 588 Negligence ratio: 100 x (S2 - S1)/S1 = 26.7% Evaluation ratio: 100 x (S3 - S2)/S2 = 37.7% • Prevention ratio: 100 x S1/(7 x total) = 43.7%
Interpretation of STAM Metrics 1. Errors are detected 27% later than they should have been (I.e. if the inspection processes worked perfectly) 2. The design of the inspection processes imply that errors are detected 38% into the phase following their creation. 3. Ideally all errors are requirements errors, and they are detected in the requirements phase. In this example only 47% of this ideal is materialized implying significant opportunities for improvement.
Conclusions • Inspection processes need to be designed in the context of a software life cycle • Inspection processes need to be evaluated using quantitative metrics • STAM metrics provide such an evaluation • STAM metrics should be integrated in an overall measurement program Thank you!