Download
1 / 17
170 likes | 344 Views
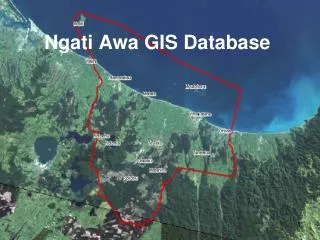
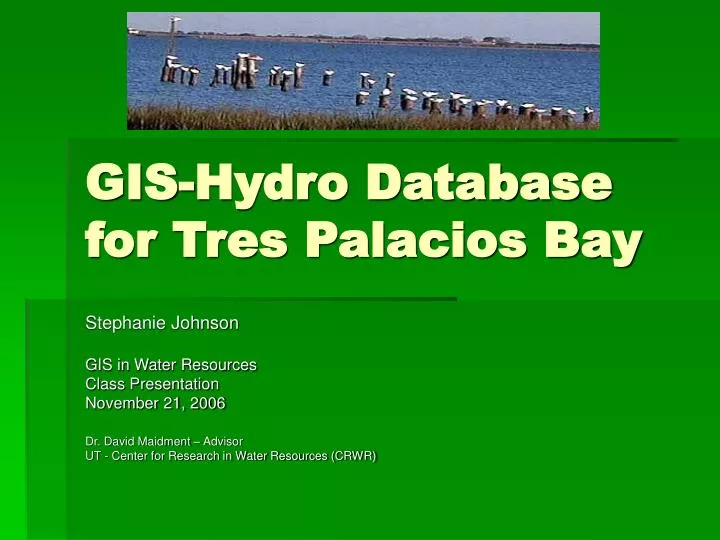
GIS-Hydro Database for Tres Palacios Bay. Stephanie Johnson GIS in Water Resources Class Presentation November 21, 2006 Dr. David Maidment – Advisor UT - Center for Research in Water Resources (CRWR). Study Area. Tres Palacios Bay.

E N D
GIS-Hydro Database for Tres Palacios Bay Stephanie Johnson GIS in Water Resources Class Presentation November 21, 2006 Dr. David Maidment – Advisor UT - Center for Research in Water Resources (CRWR)
Tres Palacios Bay • Determined to not meet dissolved oxygen standards of 5 mg/L • TCEQ begins a dissolved oxygen TMDL study • Overseen by Dr. Paul Montagna, Texas A&M Corpus Christi • Water quality monitoring for the past 2 years • UT-CRWR asked to help with water quality modeling
Objective of Project • Develop a GIS-based dataset for future water quality modeling • Introductory qualitative analysis of monitoring data • Use as a test for webscraper tool that calculates duration curves
Dataset Roads/Cities Soils • Base map – used as a guide • Developed by Sally Morehead, M.S. at UT-Austin Marine Science Institute for initial efforts in study • Hydrography • Tyler Jantzen at CRWR - NHDPlus data • Jantzen is supported by TNRIS to develop TX NHDPlus Data for his M.S. thesis • General data • Texas General Land Office (GLO) – Political boundaries, roads, etc. • Federal agencies – NRCS soil and landuse, etc. • Local data sources • TCEQ – Water quality monitoring stations • Dr. Paul Montagna – water quality monitoring points in Tres Palacios Bay
1 USGS flow gage on the Tres Palacios River 27 TCEQ TRACS river monitoring points 4 monitoring points in Tres Palacios Bay 17 TCEQ TRACS monitoring points in Tres Palacios Bay Monitoring Points
Qualitative Analysis • Patterns in low D.O. levels • Location • Time of year • Natural events (flow regime) • Theorize potential sources of pollution • Non-point vs. point • Municipal vs. rural (Yet to be completed)
Load Duration Curve • Basically a cumulative frequency distribution • Derived from a flow duration curve • Multiply flow duration curve by the desired pollutant concentration and a conversion factor • Outcome: allowable load/day
Example Low Flow High Flow Applying the water quality standard of 0.05 mg/L TP: Source: White Paper (1): Advantages and Disadvantages of Using Load Duration Curves to Estimate Existing and Allowable Loads for the Development of Nutrient TMDLs
Future Work • For GIS Project • Qualitative analysis of monitoring data • Create more duration curves for Tres Palacios River • Future Modeling • Use data to develop a dissolved oxygen water quality model • Use runoff and land use data to determine the nutrient load from each catchment • Create duration curves for non-point source nutrient loads
Credits • Thanks to: Dr. David Maidment, Tyler Jantzen, Dr. Paul Montagna, Ernest To, Sally Morehead, CRWR staff Photos from: http://www.portofpalacios.com