Download
1 / 34
340 likes | 342 Views
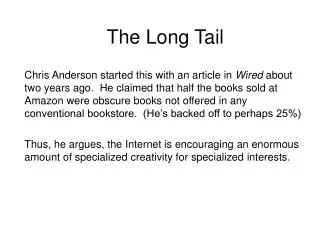
This research examines the impact of long tail distributions on big data accesses. It explores how the head is lowered and the tail is dropped more slowly, resulting in changes to the distribution. The study also analyzes the changes in DVD distribution on Netflix from 2000 to 2011 as a case study.

E N D
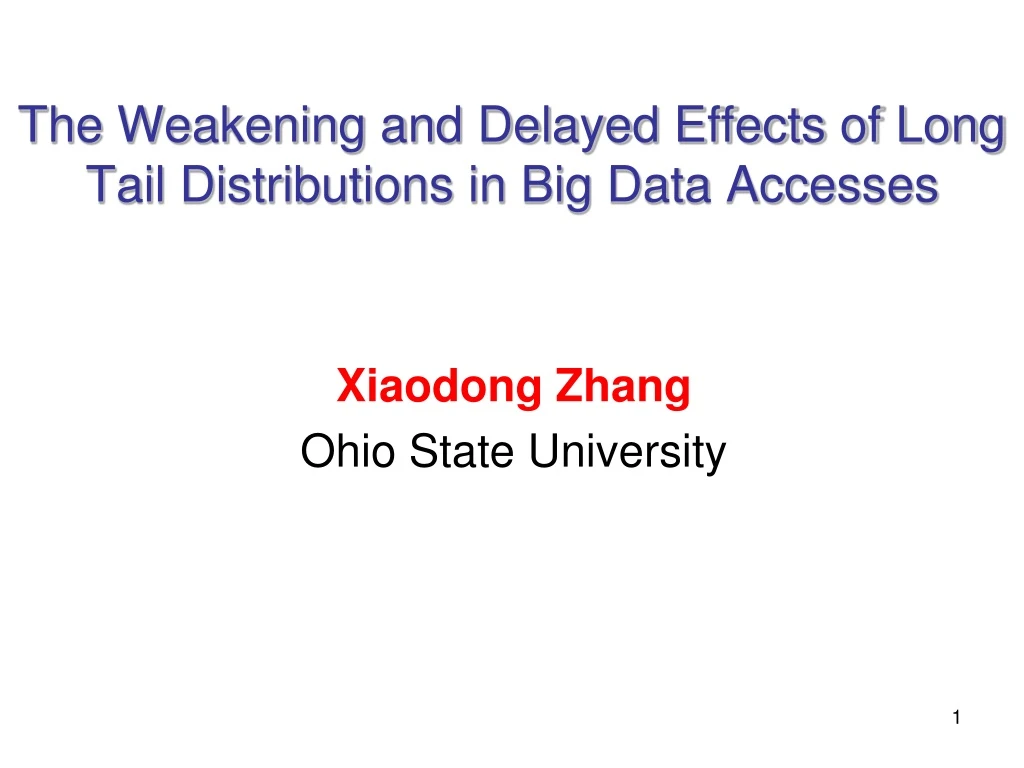
The Weakening and Delayed Effects of Long Tail Distributions in Big Data Accesses Xiaodong Zhang Ohio State University
# of hits to each data object Big Data and Power Law Popularity ranks for each data object To the rights (the yellow region) is the long tail of lower 80% objects; to the left are the few that dominate (the top 20% objects). With limited space to store objects and limited search ability to a large volume of objects, most attentions and hits have to be in the top 20% objects, ignoring the long tail.
The Change of Time (short search latency) and Space (unlimited storage capacity) for Big Data Creates Different Data Access Distributions • The head is lowered and the tail is dropped more and more slowly • If the flattered distribution is not power law anymore, what is it? Traditional long tail distribution Flattered distribution after the long tail can be easily accessed
Distribution Changes in DVDs in Netflix 2000 to 2011 • The growth of Netflix selections ( today: 30 million US users, 40 million users total, 1/3 streaming traffic of Internet) • 2000: 4,500 DVDs, 2005: 18,000 DVDs • 2011: over 100,000 DVDs (the long tail would be dropped even more slowly for more demands) • Note: “breaks and mortar retailers”: face-to-face sell shops. 2011 predicted
We Must Find the New Distribution for Big Data Accesses • Internet stores all kinds of huge big data sets • The rapid growth and wide distribution of Internetmedia content is a representative case study of big data • The media content is carried by scalable distributed systems • We hope distribution model developed is • General purpose for other applications of big data • Scalability nature of both data and systems
log y y slope: -a heavy tail log i i Zipf distribution is believed the general model of data access patterns • Zipf distribution (power law) • Characterizes the property of scale invariance • Heavy tailed, scale free • 80-20 rule • Income distribution: 80% of social wealth owned by 20% people (Pareto law) • Web traffic: 80% Web requests access 20% pages (Breslau, INFOCOM’99) • System implications • Objectively caching the working set in proxy • Significantly reduce network traffic a:0.6~0.8 i : rank of objects yi : number of references
Web media systems VoD media systems P2P media systems Live streaming and IPTV systems Does Internet media traffic follow Zipf’s law? Chesire, USITS’01: Zipf-like Cherkasova, NOSSDAV’02: non-Zipf Acharya, MMCN’00: non-Zipf Yu, EUROSYS’06: Zipf-like Veloso, IMW’02: Zipf-like Sripanidkulchai, IMC’04: non-Zipf Gummadi, SOSP’03: non-Zipf Iamnitchi, INFOCOM’04: Zipf-like
heuristic assumptions Inconsistent media access pattern models • Still based on the Zipf model • Zipf with exponential cutoff • Zipf-Mandelbrot distribution • Generalized Zipf-like distribution • Two-mode Zipf distribution • Fetch-at-most-once effect • Parabolic fractal distribution • … • All case studies • Based on one or two workloads • Different from or even conflict with each other • An insightful understanding is essential to • Content delivery system design • Internet resource provisioning • Performance optimization
Research Objectives • Find a general distribution model of Internet media access patternsas a case for big data • Comprehensive measurements and experiments • Rigorous mathematical analysis and modeling • Insights into media system designs
Outline • Motivation and objectives • Stretched exponential model of Internet media traffic • Dynamics of access patterns in media systems • Caching implications and storage requirements • Summary • Other newly reported SE distributions in real world
Workload summary • 16 workloads in different media systems • Web, VoD, P2P, and live streaming • Both client side and server side • Different delivery techniques • Downloading, streaming, pseudo streaming • Overlay multicast, P2P exchange, P2P swarming • Data set characteristics • Workload duration: 5 days - two years • Number of users: 103 - 105 • Number of requests: 104 - 108 • Number of objects: 102 - 106 nearly all workloads available on the Internet all major delivery techniques data sets of different scales
Distribution Changes in DVDs in Netflix 2000 to 2011 • The growth of Netflix selections ( today: 30 million US users, 40 million users total, 1/3 streaming traffic of Internet) • 2000: 4,500 DVDs, 2005: 18,000 DVDs • 2011: over 100,000 DVDs (the long tail would be dropped even more slowly for more demands) • Note: “breaks and mortar retailers”: face-to-face sell shops. 2011 predicted
log y yc fat head slope:-a b thin tail log i log i Stretched exponential distribution • Media reference rank follows stretched exponential distribution (passed Chi-square test) Probability distribution: Weibull c: stretch factor Rank distribution: • fat head and thin tail in log-log scale • straight line in logx-yc scale c: stretch factor i : rank of media objects (N objects) y : number of references
Evidences: Web media systems (server logs) fat head thin tail ST-SVR-01 (15 MB) *HPLabs-99 (120 MB) *HPC-98 (14 MB) powered scaleyc log scale c = 0.22 R2 ~ 1 log scale in x axis x: rank of media object, y: number of references to the object. Title: workload name (median file size) data in stretched exponential scale data in log-log scale R2: coefficient of determination (1 means a perfect fit) HPC-98: enterprise streaming media server logs of HP corporation (29 months) HPLabs: logs of video streaming server for employees in HP Labs (21 months) ST-SVR-01: an enterprise streaming media server log workload like HPC-98 (4 months)
Evidences: Web media systems (req packets) fat head thin tail ST-CLT-05 (4.5 MB) ST-CLT-04 (2 MB) PS-CLT-04 (1.5 MB) powered scaleyc log scale log scale in x axis All collected from a large cable network hosted by a well-known ISP PS-CLT-04: first IP packets of HTTP requests for media objects (downloading and pseudo streaming), 9 days ST-CLT-04: RTSP/MMS streaming requests (on-demand media), 9 days ST-CLT-05: RTSP/MMS streaming requests (on-demand media), 11 days
mMoD-98: logs of a multicast Media-on-Demand video server, 194 days CTVoD-04: streaming serer logs of a large VoD system by China telecom, 219 days, reported as Zipf in EUROSYS’06 IFILM-06: number of web page clicks to video clips in IFILM site, 16 weeks (one week for the figure) YouTube-06: cumulative number of requests to YouTube video clips, by crawling on web pages publishing the data Evidences: VoD media systems fat head thin tail *CTVoD-04 (300 MB) *mMoD-98 (125 MB) powered scaleyc log scale log scale in x axis YouTube-06 (3.4 MB) IFILM-06 (2.25 MB)
Evidences: P2P media systems *KaZaa-03 (5 MB) BT-03 (636 MB) *KaZaa-02 (300 MB) KaZaa-02: large video file (> 100 MB. Files smaller than 100 MB are intensively removed) transferring in KaZaa network, collected in a campus network, 203 days. KaZaa-03: music files, movie clips, and movie files downloading in KaZaa network, 5 days, reported as Zipf in INFOCOM’04. BT-03: 48 days BitTorrent file downloading (large video and DVD images) recorded by two tracker sites
Evidences: Live streaming and other systems Movie-02 IMDB-06 Akamai-03 Akamai-03: server logs of live streaming media collected from akamai CDN, 3 months, reported as two-mode Zipf in IMC’04 Movie-02: US movie box office ticket sales of year 2002. IMDB-06: cumulative number of votes for top 250 movies in Internet Movie Database web site
Why Zipf was observed in the past? ad server cache proxy media server • Media traffic is driven by user requests • Intermediate systems may affect traffic pattern • Effect of extraneous traffic • Filtering effect due to caching • Biased measurements may cause Zipf observation
ads clip flag clip video prog 1 flag clip video prog 2 ads clip flag clip video prog 1 flag clip video prog 2 Extraneous media traffic ads server ads clip meta file link web server flag clip ad and flag video are pushed to clients mandatorily streaming media server video program
Reference rates without extraneous traffic SE 2004 SE 2005 prog ads flag Effects of extraneous traffic on reference rank distributions • Do not represent user access patterns • High request rate (high popularity) • High total number of requests • Not necessary Zipf with extraneous traffic • Extraneous traffic changes • Always SE without extraneous traffic • Small object sizes, small traffic volume with extraneous traffic 2004: 2 objects 2005: merged into 1 object Non-Zipf Zipf 2005 2004
“Rich-get-richer” phenomenon Pareto, power law, … The structure of WWW Web accesses are Zipf Popular pages can attract more users Pages update to keep popular Zipf-like for long duration Media accesses are big data based Popularity decreases with time exponentially Media objects are permanantly stored Rich-get-richer not present Non-Zipf in long duration CCDF of req (log) 103 ------ raw data ------ linear fit 102 BitTorrent media file 101 100 0 100 200 Time after object birth (day) Fundamental Differences between Zipf and SE 16 1 Number of distinct weekly top N popular objects in 16 weeks Top 1 Web object never changes Top 1 video object changes every week
yc slope:-a b log i Dynamics of Access Patterns in Media Systems • Media reference rank distribution in log-log scale • Different systems have different access patterns • The distribution changes over time in a system (NOSSDAV’02) • All follow stretched exponential distribution • Stretch factor c • Minus of slope a • Physical meanings • Media file sizes • Aging effects of media objects • Deviation from the Zipf model c: stretch factor
yc slope: -a b log i Stretched exponential parameters • In a media system • Constant request rate • Constant object birth rate • Constant median file size • Stretch factor c is a time invariant constant • Parameter a increases with time
Huge capacity for long life-span accesses 50% 50% 200 days 150 days • Media objects have long lifespan • Most requested objects are created long time ago • Most requests are for objects created long time ago • To achieve maximal concentration • Very long time (months to years) • Huge amount of storage • Only large and scalable systems provide such a huge space with a long time
Summary • Media access patterns do not fit Zipf model, so doesn’t big data • We give reasons why previous distributions were confusing • Media access patterns are stretched exponential • Our findings imply that • Client-server proxy systems is not effective to deliver media contents • Scalable distributed systems are suitable for this purpose • The storage system in cloud systems must be very scalable • We believe the stretched exponential model is sufficiently general for big data accesses.
log y log y fat head slope:-a thin tail log i log i Two Distribution Models are Based on Different Storage Requirements • Accesses to big data (e.g. Internet media) follows stretched exponential distribution The SE curve implies a wide range access distribution in long period of time. Rank distribution: • fat head and thin tail in log-log scale • weak locality needs a huge and distributed storage The sharp zipfslope implies a concentrated access distribution on a small number of objects • strong locality makes proxy cache very effective
Other Reported Data Access Distributions Fitting SE(after PODC’08) Internet Video/audio services • IPTV, user channel selection distribution (SIGMETRICS’09) • PPLive, P2P streaming request distribution (ICDCS’09) • Access distribution in PPStream is converting from zipf (2007) to stretched exponential (2009) (a report from Nanjing Statistical Institute) • USTC-VOD, Shanghai Jiading TVOD: program request distributions (China National College Statistical Modeling Competition Outstanding award project, 09) • User listening behavior of Bugs Music (http://www.bugs.co.kr) in Korea, 72K users, 400K songs, 15M log records (ICIS’10) • BitTorrent Video-on-demand accesses (NSM 2010) • VUCLIP (video service to mobile devices): access distributions in servers, (INFOCOM’12) • News-on-demand services from 6 Spanish newspapers (IJMA’12) • Viewer access patterns to a large TV-on-demand system in Sweden (IMC’12) • Mobile viewer access patterns to PPTV VoD system in China (IMC’12)
Other Reported Data Access Distributions Fitting SE(after PODC’08) Social networks • Wikipedia, Yahoo answers,social network posting distribution (KDD’09) • digg.com, (a discussion social network), comment distribution (ICMD’10) • ireport.com (CNN discussion social network), comment distribution (ICMD’10) • sina, tudou, i-baidu (social networks in China), access patterns, (ICDCN’10) • 20minutes.fr (a France news social network), access patterns (U. Paris, 12) • YouKu (largest user generated video site in China), subscription and access patterns (ICCCN’12, ICPP’12) • Yahoo HK blog, posting from SE to power law after being spammed (ICDCS’12) • Facebook Photo Serving Stack (in the backend Haystack storage), access patterns show SE distributions (SOSP’13) Bioinfomatics • Protein abundances (density vs structure space, Proteome Science, 2013)
Other Reported Data Access Distributions Fitting SE(after PODC’08) General data accesses via Internet • Web access patterns in American University of Nigeria in Africa (AMCIS’09) • Access patterns to AmazingStore in China (http://www.amazingstore.org), a P2P storage for college students to access TeraBytes of files (TPDS, 2011) • FS2You (online storage system in China), file request distribution (INFOCOM’09)
Global Research Collaborations Touch the Long Tail(1998-2013)
Comparing distribution patterns between 1998 and 2013 First excise: • Finding the collaboration data from the link • Writing a note on the data availability • Making the figure as US-centric (US should not be in the figure) • Plotting the number of collections (vertical bar), sorted by the collaborating countries with US, comparing the shape of the two figures • Making a log operation on the data on both vertical and horizontal bars, and compare the slope. • Writing notes on your observations.
G = A/(A+B) Area A shrinks: Accesses to big data are less concentrating Gap of rich and poor is narrowed Another view of Big Data Access Patterns: Gini Coefficient