Download
1 / 27
270 likes | 372 Views
Data Analyses Skills (ID6020 Module). Rahul R. Marathe Department of Management Studies. Introduction: Why?. Numbers everywhere! -- Last year, ID6020 had 243 students registered. This year the number is 271.

E N D
Data Analyses Skills(ID6020 Module) Rahul R. Marathe Department of Management Studies
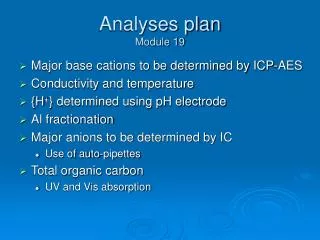
Introduction: Why? Numbers everywhere! -- Last year, ID6020 had 243 students registered. This year the number is 271. -- Average time required to complete a typical catalysis experiment under laboratory conditions is 34.7. • Successful professionals are those who can make sense of these numbers. • In today’s world, it is more the case of information overload – too much data! It is our job to make this data tell us a story! • Sort out what is important and what is not!
Introduction: Why? • Whether you will be audited by income tax authorities depends a lot on sampling techniques used by the IT department, and also on you hitting certain numerical signals. • The urban traffic planning is done using the data collected from various locations in a city. • Market research firms use statistical techniques on point-of-sale data to understand buyer behavior. • Suitability of a drug is decided by analyzing the field data collected from trials conducted. • That’s why every professional should know these techniques.
Introduction: Why? • Data analysis done traditionally through “Statistical techniques”; in recent times, we call this “Data Analytics”. • Today, not only relies on statistical techniques, but encompasses other domains such as data mining. • Data analysis – Understanding the story told by the numbers!
Introduction: Data • Data: Any related observations. • A collection of data is the data set and single observation is data point. • Data can be collected by: • Observations of incidences occurring (direct recording) • Surveys (and sampling) • Conducting experiments etc. • Data collection is the most important step. Because, if the collected data is not correct, analyses and conclusions are incorrect and misleading!
Data collection Before relying on any data, test the data by asking: • Where did the data come from? Is the source biased? • Do the data support or contradict other evidence we have? • Is the evidence missing that might cause us to come to a different conclusion? • How many observations do we have? Do they represent all the groups we wish to study? • Are the conclusions logical? Have we made conclusions that is not supported by data?
Example of misleading data • Trucking company advertises “75% of everything you use travels by truck.” • What do you conclude?
Before the data analyses…. Identify: Samples and population • A population is a collection of all the elements one wants to study and about which one is trying to draw conclusions. • A sample is a collection of some, but not all, of the elements of a population. Consider a beauty soap which is targeted at middle–class women customer aged between 18 and 45 years, The population is the entire set of middle-class females of age between 18 – 45. But you need to be careful about definition of “middle-class”. Clearly, a school girl is not a member of the population. Sample is any subset of the above set.
Before the data analyses…. • Identify and classify variables
Quick check • Can variables with nominal scale be quantitative? Yes or No. No – Nominal scale has categories. Categories are for qualitative data. • Can variables with ordinal scale be qualitative? Yes or No. Could be qualitative; could be quantitative. So yes! • Can nominal or ordinal scale be continuous? Yes or No. No! Nominal or ordinal scale is for categorical data. Categorical variables are discrete. Example? • Can interval scale be continuous and/or discrete? Yes or No. It can be either continuous or discrete. Example?
Before the data analyses…. • Check and question the assumptions made: • Linearity • Normality • Symmetry • Effect of uncommon observation
Before the data analyses…. • Understand the purpose: Data analyses is done to identify and understand patterns in data and use this information to make better decisions. DATA = STRUCTURE + NON-STRUCTURE DATA = EXPLAINED BEHAVIOR + WHITE NOISE
Steps in data analysis • Once data is collected, we need to summarize, interpret and make sense. • Three categories: • Descriptive statistics: How can the data be summarized? • Inferential statistics: How can we draw inferences from the data? • Predictive statistics: How can we build predictive models using the data available?
Summary of data • Describe the data in graphical or statistical way: Some of commonly used graphical tools – Frequency distribution tables; Line charts; Histogram; Higher dimensional plots; Scatter plot Use of summary statistics – • Measures of central tendency (measures of location) Examples? • Measures of dispersion (extent of scatter) Examples? • Measure of symmetry (skewness) • Etc.
Interpretation and prediction Should depend on: • Data (variable) type; • Amount of data; • Expected type of conclusions. • Data type:
Questions to ask • Want to know: Reasons for failure • Also: factors that may contribute to failure • Is the data valid? • Is the data sufficient? • Can the conclusions be extrapolated? • Possible methodology: Clustering algorithms.
Example: Chemical reaction • Time required to complete a chemical reaction in a set of experiments: 24.2, 20.15, 17.11, 14.83, … Do you see a trend? Can we be more specific? Solution methodology: Forecasting What if the data has uncertainty?
What should you be asking? “Average time required to complete a typical catalysis experiment under laboratory conditions is 34.7.” • What do you mean by “typical”? • What were the other sample values? Was average value affected by extreme values? • What are the units?
Data analyses Do’s: • Apply the correct analysis technique • Understand the assumptions of the method • Enter the data in the selected technique correctly • Use the correct equations/software • Be very careful about the conclusions you draw. Dont’s • Try each and every technique to decide which “looks” good. • Get fooled by jazzy graphs and colors. • Extrapolate results and conclusions.
What should you be reading? • Start from basic Data Analysis textbooks – understand the basics first. • Read the advanced texts and research articles – need based learning (see what you require, understand the pre-requisites and then master the technique). • General reading should never stop!!! e.g. “Freakonomics”: To understand what fun one can have simply by playing with data!!
Final word • Data analyses skills are extremely important and useful. • Every researcher is going to require these skills at some point or the other. • Equip yourself with these techniques and you are better prepared for the battle of logic. • These weapons in your armory have to be used carefully, and after knowing their capabilities (and limitations). • Don’t make the mistake of beating everything with the same stick – different demons require different tools!
Best wishes!!Questions? Comments? rrmarathe_at_iitm.ac.in