Download
1 / 33
330 likes | 484 Views
22 July, 2009 Total Solar Eclipse: Effect on D-region Ionosphere Dynamics as Studied from AWESOME VLF Observations. Rajesh Singh B. Veenadhari, A.K. Maurya Indian Institute of Geomagnetism. P. Pant: ARIES, Manora Peak, Nainital – India

E N D
22 July, 2009 Total Solar Eclipse: Effect on D-region Ionosphere Dynamics as Studied from AWESOME VLF Observations Rajesh Singh B. Veenadhari, A.K. Maurya Indian Institute of Geomagnetism P. Pant: ARIES, Manora Peak, Nainital – India A.K. Singh: Physics Department, B.H.U. , Varanasi – India
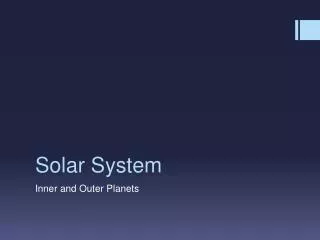
~ 03.50 Hrs ~ 200 – 260 Km ~ 3 – 5 minuets ~ 15,150 Km: 71% Earth Area
Principle Sources of Ion production in D-region Ionosphere during: Daily usual Sun There are several sources of ion production for ionospheric D region: Lyman-alpha line of the solar spectrum at 121.5 nm wavelength penetrates below 95 km and ionize the minor species NO The EUV radiation between 80.0 and 111.8 nm wavelength and X-rays of 02-0.8 nm wavelength ionize O2 and N2 and thus are the main sources of the free electrons in the ionospheric D region during: Eclipsed Sun • During Total Solar Eclipse, D-region ionosphere of the umbral & penumbral shadow portion of the earth experiences sudden changes. • So solar eclipses provide opportunities to study the physical and chemical processes which determine the behavior of D-region ionosphere
Carried out both measurements: Narrowband & Broadband (Continuous)
AWESOME sites in observation on 22 July 2009 TSE SID in Bhusan, Korea
Clilverd et al., 2001: August 11, 1999 Total Solar eclipse effect • Used both medium and long path VLF signals • Observed positive amplitude change on path lengths < 2000 km • Negative amplitude changes on paths > 10,000 km • Negative phase changes were observed on most paths, independent of path lengths They further calculated electron concentration values at 77 km altitude throughout the period of solar eclipse, which showed a linear variation in electron production rate with solar ionizing radiation.
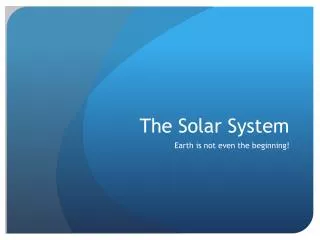
Distance to NWC~ 6700 km 40% Distance to JJI ~ 4750 km Totality at 01:50:00 UT ~ 57 minutes Totality at 00:53:00 UT 40% Indian Stations
Maximum at ~00:57:00 UT to JJI (22.2kHz) Two signals - NWC & JJI (1) Intersecting the totality path (2) Along the totality path Totality at ~00:55:00 UT ~ 45 seconds Totality at ~00:56:00 UT 3 min 12 seconds to NWC (19.8kHz)
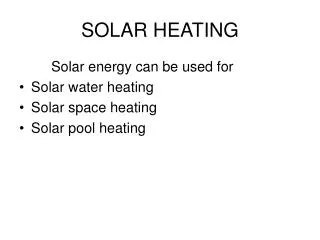
Effect on NWC:Intersecting the Path of Totality at: Allahabad • Allahabad: 25.400 N 81.930 E • Eclipse Magnitude = 1 • Totality Duration = 45.6 sec • Start of Partial Eclipse - 00:00:17.00 • Start of Total Eclipse - 00:55:08.9 • Maximum Eclipse - 00:55:31.4 • End of Total Eclipse - 00:55:54.3 • End of Partial Eclipse - 01:56:46.1 (Time in UT) Decrease in Amplitude of signal as the eclipse progresses Maximum depression around the period of TOTALITY ( ~ 45 sec) A significant decrease in amplitude of 1.5 dB is observed Reaching minimum close to time of totality on the ~ 6700 km path between NWC VLF transmitter and Allahabad Also shift in Morning terminator time is seen from ~ 00:30 UT to time in eclipse totality to NWC (19.8kHz)
Effect on NWC: Intersecting the Path of Totality at: Varanasi Decrease in Amplitude, Minimum depression around the period of TOTALITY A significant decrease in amplitude of 2.5 dB is observed Extended period of depression is observed because totality period is ~ 3 min 12 sec Reaching minimum close to time of totality on the ~ 6700 km path between NWC VLF transmitter and Varanasi Here again shift in Morning terminator time from ~ 00:30 UT to time in eclipse totality • Varanasi: 25.270 N 82.980 E • Eclipse Magnitude = 1.015 • TotalityDuration= 3 min 11.5 sec • Start of Partial Eclipse: 00:00:03 • Start of Total Eclipse: 00:54:08 • Maximum Eclipse: 00:55:42.6 • End of Total Eclipse: 00:57:17.1 • End of Partial Eclipse: 01:56:46 (Time in UT) to NWC (19.8kHz)
Effect on NWC: Intersecting the Path of Totality at: Nainital • Nainital: 29.350 N 79.450 E • Eclipse Magnitude = 0.845 • NO Totality • Start of Partial Eclipse - 00:03:36 • Maximum Eclipse - 00:57:18 • End of Partial Eclipse - 01:56:19 (Time in UT) First increase in amplitude is seen with the start of eclipse Then a significant decrease in amplitude of is observed around the time of maximum eclipse to NWC (19.8kHz)
100% 100% 85%
Observations from SID: Bushan, S. Korea Bushan Y-Sil Kwak:KASI, Daejeon - South Korea S Park: KAIST, Bushan - South Korea
Observations from Tashkent 21 July 22 July figure: courtesy Yusuf and Boboamurat
Observations from Azerbaijan Modeling is REQUIRED! figure: courtesy Elchin Babayev
Continuous Broadband Observations - Tweek Radio Atmospherics
By analyzing the dispersive part of tweeks we can estimate : • Reflection height (h) of lower region (D-region) of ionosphere • Night time Electron density (N) • Propagation distance (d) in Earth-Ionosphere wave-guide
Broadband signals during Total Solar Eclipse: only ONE case The only example of ionospheric study during eclipse with VLF signal is by Rycroft and Reeve, 1970, Nature, 226, 1126; 1972, JATP, 34, 667 Estimated increase in ionospheric reflection height by 7 km during eclipse of March 7, 1970 from the measurements of tweeks
Tweek Examples during TSE Observed ~ 40 Tweeks ~ around Totality ~ 30 min before Totality ~ around Totality ~ 30 min After Totality
Ionospheric Reflection Height and Electron Density Variation during TSE TSE Period
SUMMARY During the total solar eclipse of 22 July 2009 measurements of NWC(19.8 kHz) and JJI(221.2 kHz) VLF transmitter signals where made in India at three sites Distance from transmitter to receiver ranged from 6700 km (NWC) & 4750 km (JJI). One path intersecting and other parallel to the movement of totality region Typically negative amplitude changes are seen for the NWC signals whose path intersect the region of totality And positive amplitude changes are seen for the JJI signal, which have its propagation path parallel to
The positive and negative changes in amplitude of the VLF signals throughout the whole solar eclipse period shows the changes in D-region ionosphere during eclipse Broad band observations of Tweek radio atmospherics shows the lower boundary of ionosphere and electron density moving to the levels of night Further D region ionosphere modeling for earth-ionosphere waveguide propagation NEEDS TO BE DONE to quantitatively infer the information during eclipse period – changes in the ionosphere height, relation between ion production rate and solar ionization, etc..
Total Solar Eclipse- view from Allahabad Thank you for kind attention !
Importance VLF waves in study of D-region of the Ionosphere D-regionis lowest part ofionosphereextended from ~ 50-90 km Electron density : ~ 2.5x10³ el/ccby dayanddecreases to < 103 el/cc at night It is generally difficult to measure the ionospheric D region on continuous basis because ionosondes and incoherent scatter radars in the HF-VHF range do not receive echos from this region, where electron density is typically < 103 cm-3 The altitude (~70-90 km) of this region are far too high for balloons and too low for satellites to reach, making continuous monitoring of the ionospheric D region difficult
Study of 11 August, 1999 Solar eclipse in Indian Longitude (Sridharan et al., 2002, Ann. Geophy.) Electrodynamics of the equatorial E- and F- region was studies with observations from ionosondes, VHF and HF radars at Trivandrum Reported sudden intensification of weak blanketing type Es-layer irregularities, which was pushed down by ~ 8 km during the eclipse.
Importance VLF waves in study of D-region of the Ionosphere Because of the fact that VLF waves are almost completely reflected by the D region makes them as a useful tool for studies in this altitude range Ground based measurements of ELF/VLF waves makes it possible to monitor the state of the D region ionosphere more routinely Carried out both Narrowband and Broadband (Continuous) measurements