Download
1 / 20
200 likes | 324 Views
LESSON ONE. The Scientific Method. NEXT. Watch the BrainPop video and complete your worksheet. You can pause and rewind the video clip to help you get your answers. Take the quiz after the video and record the correct answers on your worksheet. Part 1: Scientific Method Review. NEXT.

E N D
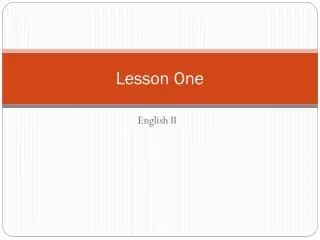
LESSON ONE The Scientific Method NEXT
Watch the BrainPop video and complete your worksheet. You can pause and rewind the video clip to help you get your answers. Take the quiz after the video and record the correct answers on your worksheet. Part 1: Scientific Method Review NEXT
Part 2:The Pizza Experiment Data Collection and Analysis NEXT
Background: • It is Thursday and Brian is going to make pizza tomorrow night for friends. The last time he made pizza, the dough did not rise. He wanted to know why, so he researched how yeast works. He found that there was a connection between yeast, sugar, and dough rising. To figure out the connection, he designed an experiment to test the effect of sugar on making dough rise. Brian knows that the more CO2 that is produced by the yeast cells during fermentation, the more the dough will rise. NEXT
Experimental Design: • Each bottle gets ¼ cup warm water and ¼ teaspoon of yeast. • Put the following amount of sugar into each bottle: • A = No sugar • B = ¼ teaspoon sugar • C = ½ teaspoon sugar • D = 1 teaspoon sugar • Place a balloon over the top of each of the four bottles to collect the CO2 given off by the yeast going through fermentation. • Measure and record the change in the circumference of each balloon at ½ hour intervals for four hours. A B C D NEXT
Results:Initial Measurements (0 min.)Record your results on your data table. A B C D 0 cm 0 cm 0 cm 0 cm NEXT
Results:Measurements after 30 min. Record your results on your data table. A B C D 0 cm 1 cm 2 cm 2.5 cm NEXT
Results:Measurements after 60 min. Record your results on your data table. A B C D 0 cm 2 cm 2.5 cm 3.5 cm NEXT
Results:Measurements after 90 min. Record your results on your data table. A B C D 0 cm 3 cm 3.5 cm 4 cm NEXT
Results:Measurements after 120 min. Record your results on your data table. A B C D 0 cm 4 cm 4 cm 6 cm NEXT
Results:Measurements after 180 min. Record your results on your data table. A B C D 0 cm 5 cm 6 cm 9 cm NEXT
Results:Measurements after 210 min. Record your results on your data table. A B C D 0 cm 5.5 cm 7.5 cm 14 cm NEXT
Results:Measurements after 240 min. Record your results on your data table. A B C D 0 cm 5.5 cm 9 cm 20 cm NEXT
Analysis Questions:Answer the following questions on your worksheet…your vocabulary words have been linked to their definitions if you need extra help! • What is the independent variablein this experiment? Why? • What is the dependent variablein this experiment? Why? • Is there a control in this experiment? Explain. NEXT
Data Analysis: • Use your data table to create a line graph for the pizza experiment. • On your graph be sure to include: • A title • Lines for each of the four bottles used • A legend (key) to identify each of the lines • Axes labeled with the appropriate variables, scales, and units Click here for hints on setting up graphs. NEXT
Conclusion:Answer the following questions on your worksheet…your vocabulary words have been linked to their definitions if you need extra help! • What would you advise Brian to do to make his pizza dough rise well? Support your answer with data from the graph. • Define fermentation. • What are some possible sources of error in his experiment? Discuss at least 2. NEXT
Part 3: Designing an Experiment • In this last activity you are going to put to the test all of the skills you mastered in part 1 & 2 to design your own experiment. NEXT
In this optical illusion you should be able to see both a beautiful young woman and an old hag. Think about the following: Which did you see first? Do you think everyone sees the same thing first? Does age make a difference to what you see first? Does gender? Look very carefully at the picture… CLICK ON THE IMAGE TO SEE HINTS! NEXT
Designing an Experiment: • Develop an experiment to answer the following question/problem: • Does the age of the viewer make a difference in whether he/she first sees the beauty of the hag when looking at the optical illusion? NEXT
In your experiment be sure to include the following: • A hypothesis. • Identify the independent variable. • Identify the dependent variable. • An experimental design.