Download
1 / 5
50 likes | 192 Views
Moving Averages. OCR Stage 8. Why use them?. Moving Averages, when graphed, allow us to see any trends in data that are cyclical By calculating the average of 2 or more items in the data, any peaks and troughs are smoothed out. 265. 269.25. 265.25. 270.75. 4 Period Moving Average.

E N D
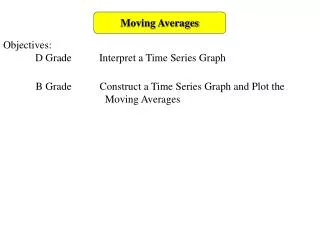
Moving Averages OCR Stage 8
Why use them? • Moving Averages, when graphed, allow us to see any trends in data that are cyclical • By calculating the average of 2 or more items in the data, any peaks and troughs are smoothed out.
265 269.25 265.25 270.75 4 Period Moving Average
500 x 400 x x 300 x x x x x x x x x x x x x x x 200 x x x 100 1 4 2 3 1 4 2 3 1 4 2 3 1998 1996 1997