Download
1 / 58
580 likes | 669 Views
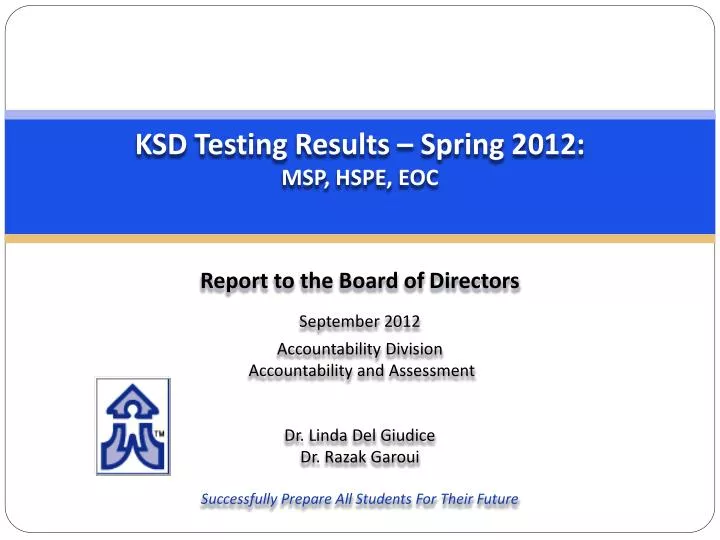
KSD Testing Results – Spring 2012: MSP, HSPE, EOC. Report to the Board of Directors September 2012 Accountability Division Accountability and Assessment Dr. Linda Del Giudice Dr. Razak Garoui Successfully Prepare All Students For Their Future.

E N D
KSD Testing Results – Spring 2012: MSP, HSPE, EOC Report to the Board of Directors September 2012 Accountability Division Accountability and Assessment Dr. Linda Del Giudice Dr. Razak Garoui Successfully Prepare All Students For Their Future
KENT SCHOOL DISTRICTSuccessfully Prepare All Students For Their Future Kent School District 12033 SE 256th Street Kent, WA 98030 Board of Directors Debbie Straus, Board President Tim Clark, Board Vice President Karen DeBruler, Board Legislative Representative Russ Hanscom, Board Director Agda Burchard, Board Director Superintendent Dr. Edward Lee Vargas
2012 MSP/HSPE Kent School District ResultsDifference in percent meeting standards, 2011 to 2012 0.5 0.4 2.7 1.7 14.4 3.1 -4.1 10.8 -3.8 4.3 1.8 8.5 6.3 -6.2 1.4 -2.2 13.2 4.7
2012 MSP/HSPE Washington State ResultsDifference in percent meeting standards, 2011 to 2012 -4.4 4.1 3.3 0 14.7 -1.5 -1.5 3.7 0 2.4 2.6 2.2 5.0 -0.1 0 -1.1 10.4 4.7
Comparing District to State Results for 2012Difference in percent meeting standards, 2011 to 2012 2012 MSP/HSPE Kent School District ResultsDifference in percent meeting standards 2011 to 2012 2012 MSP/HSPE Washington State Results Difference in percent meeting standards 2011 to 2012 Students in KSD increased proficiency in 78% of the measures (14/18 shown above). Statewide, students increased proficiency in 56% of the measures (10/18 shown above).
State and District Results for 2012 Reading MSP/HSPE, Grades 3-8 and 10Percent Meeting Standard
State and District Results for 2012 Mathematics MSP/HSPE, Grades 3-8Percent Meeting Standard
State and District Results for 2012 Writing MSP/HSPE, Grades 4, 7, and 10Percent Meeting Standard
State and District Results for 2012 Science MSP/HSPE, Grades 5 and 8Percent Meeting Standard
State and District Results for All Students: End of Course Math 1, Math 2, and Biology Percent Meeting Standard in 2011 and 2012
State and District Results for Grade 10: End of Course Math 1, Math 2, and Biology Percent Meeting Standard in 2011 and 2012
State and District Results for Grade 10 and All, End of Course Math 1, Math 2, and Biology Percent Meeting Standard in 2011 and 2012
2012 End-of-course Math Results KSDPercent meeting standards in 2012 * Includes students who passed an EOC test before grade 10
State LevelMSP Grade 4 Reading Resultsby Race/Ethnicity, 2010 -2012
State LevelMSP Grade 4 Math Resultsby Race/Ethnicity, 2010 -2012
State Level MSP Grade 8 Math Resultsby Race/Ethnicity, 2010 -2012
State LevelMSP Grade 8 Reading Resultsby Race/Ethnicity, 2010 -2012
Kent School DistrictMSP Grade 3 Reading Resultsby Race/Ethnicity, 2010 -2012
Kent School DistrictMSP Grade 3 Math Resultsby Race/Ethnicity, 2010 -2012
Kent School DistrictMSP Grade 4 Reading Resultsby Race/Ethnicity, 2010 -2012
Kent School DistrictMSP Grade 4 Math Resultsby Race/Ethnicity, 2010 -2012
Kent School DistrictMSP Grade 4 Writing Resultsby Race/Ethnicity, 2010 -2012
Kent School DistrictMSP Grade 5 Reading Resultsby Race/Ethnicity, 2010 -2012
Kent School DistrictMSP Grade 5 Math Resultsby Race/Ethnicity, 2010 -2012
Kent School DistrictMSP Grade 5 Science Resultsby Race/Ethnicity, 2010 -2012
Kent School DistrictMSP Grade 6 Reading Resultsby Race/Ethnicity, 2010 -2012
Kent School DistrictMSP Grade 6 Math Resultsby Race/Ethnicity, 2010 -2012
Kent School DistrictMSP Grade 7 Reading Resultsby Race/Ethnicity, 2010 -2012
Kent School DistrictMSP Grade 7 Math Resultsby Race/Ethnicity, 2010 -2012
Kent School DistrictMSP Grade 7 Writing Resultsby Race/Ethnicity, 2010 -2012
Kent School DistrictMSP Grade 8 Reading Resultsby Race/Ethnicity, 2010 -2012
Kent School DistrictMSP Grade 8 Math Resultsby Race/Ethnicity, 2010 -2012
Kent School DistrictMSP Grade 8 Science Resultsby Race/Ethnicity, 2010 -2012
Kent School DistrictResults for Grade 10: HSPE Reading and WritingEnd-of-Course Exams in Math and Biology
Kent School DistrictHSPE Grade 10 Reading Resultsby Race/Ethnicity, 2010 -2012
Kent School DistrictHSPE Grade 10 Writing Resultsby Race/Ethnicity, 2010 -2012
Kent School DistrictEnd of Course Math 1 and Math 2 Results for Grade 10 by Race/Ethnicity, 2010 -2012
Kent School DistrictEnd of Course Biology (first year) Results for Grade 10 by Race/Ethnicity, 2010 -2012
Annual Measurable Objectives have replaced AYP for State, District, and School Accountability
Kent School DistrictAnnual Measurable Objective Summary 2011-2012
Kent School DistrictAnnual Measurable Objective Proficiency Detail, 2011-2012
Kent School DistrictAnnual Measurable Objective Proficiency Detail, 2011-2012
AMO Progress Needed for KSD to Achieve State Goals in Reading by 2017
AMO Progress Needed for KSD to Achieve State Goals in Reading by 2017 (shown with data table)
AMO Progress for All Students to Reach Equity and Excellence Targets in Reading by 2017, Proposed by KSD