Download
1 / 18
180 likes | 304 Views
The Great Depression. Lesson One: Measuring the Great Depression. Inflation. A general upward movement in the price of good and services in an economy. Prices of individual goods and services rise (and fall) at different rates

E N D
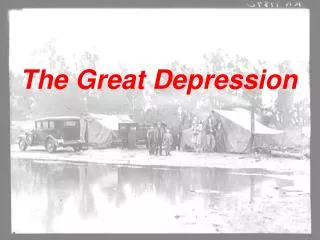
The Great Depression Lesson One: Measuring the Great Depression
Inflation • A general upward movement in the price of good and services in an economy. • Prices of individual goods and services rise (and fall) at different rates • Inflation and deflation measure the average or general tendency of price changes • The prices of some things may fall during the
Inflation continues periods of inflation (e.g., computers in the 1980) even though the prices of the majority of goods and services are rising • Although the U.S economy has not experienced a significant period of high inflation during your lifetimes, your parents or grandparents may be concerned about inflation
Inflation cont. • During a period of inflation, if prices increase at a faster rate than people’s salaries or wages, people aren’t able to buy as many goods and services.
Deflation • A general downward movement in the prices of goods and services in an economy. • There have also been periods when the U.S. economy experienced deflation. • Deflation is often accompanied by falling wages and increasing unemployment.
Deflation cont. • During periods of deflation, debtors have to repay their loans with dollars that are more valuable.
Consumer Price Index • Price stability is important to a healthy economy, price levels for the U.S. economy are measured, and there are several measures. • Consumer Price Index or CPI is use to measure price level changes
Consumer Price Index cont. • CPI is a statistic that is reported monthly and indicated annual percentage changes in price level. • CPI measures changes in the price levels as experienced by consumers in their day-to-day purchases and is used by economists to analyze the cost of living
Gross Domestic Product (GDP) • The market value of all final goods and services produced in an economy in a given year. • Economists use GDP data to measure the growth of the economy by comparing the change in GDP from one year to the next.
Gross Domestic Product cont. • The U.S. economy has grown on average about 3.0 percent to 3.5 percent annually. • “Market value” refers to the value of good and services in current prices. • Only final goods and services are count. • “Final goods and services” are those not used in the production of other goods and services
Gross Domestic Product cont. • Tires purchased by consumers to replaced the tires on a cars they currently own are counted as part of GDP • Only goods produced during the current year are counted as part of GDP for that year. • Only goods produced within a country’s border are counted as part of GDP
Gross Domestic Product cont. • When GDP is computed using current prices, inflation makes it difficult to determine how much the change in GDP from one year to the next is due to inflation and how much is the result of an increase in production of goods and services.
Gross Domestic Product cont. • “Intermediate goods” are those produced and used in the production of another product • For example, tires produced and used by a car manufacturer to assemble new cars are intermediate goods. • Only the car is counted as the Gross Domestic Product. The tires are not counted.
Gross Domestic Product cont. • GDP that has not been adjusted for inflation is referred to as nominal GDP • Real GDP - if prices have risen and GDP is calculated based on current prices, the change in the size of GDP could be due to increase prices.
Gross Domestic Product cont. • Because real GDP is adjusted for inflation,a a change in real GDP reflects an actual change in product and not a change in prices.
Visual 1.5: Real Gross Domestic Product • What information is shown on the X-axes of both graphs? • What does the trend (dotted line) on the graph indicated? • What period in history is most noticeably below the trend in GDP? • What does this suggest happened at that time?
Visual 1.6: Civilian Unemployment Rate • The graph shows the civilian unemployment rates from 1929-2006 • The unemployment rate represent the number of unemployment as a percentage of the labor force
Civilian Unemployment Questions • What information is shown on the X-axis and Y-axis of both graph? • During what years did the economy experience the lowest rates of unemployment? • What events were occurring from 1943 to 1945? • Why would employment be lowest at this time?