Download
1 / 58
580 likes | 689 Views
Error Recognition and Image Analysis Greg Taylor (UNM). With help from: Urvashi Rao, Sanjay Bhatnagar, Gustaaf van Moorsel, Justin Linford , Ed Fomalont. INTRODUCTION. Why are these two topics – ‘Error Recognition’ and ‘Image Analysis’ in the same lecture?

E N D
Error Recognition and Image AnalysisGreg Taylor (UNM) With help from: Urvashi Rao, Sanjay Bhatnagar, Gustaaf van Moorsel, Justin Linford, Ed Fomalont
INTRODUCTION • Why are these two topics – ‘Error Recognition’ and ‘Image Analysis’ in the same lecture? -- Error recognition is used to determine defects in the (visibility) data and image during and after the ‘best’ calibration, editing, etc. -- Image analysis describes the many ways in which useful insight, information and parameters can be extracted from the image. -- non-imaging analysis describes how to extract information directly from the (u,v) data • Perhaps these topics are related to the reaction one has when looking at an image after ‘good’ calibration, editing, self-calibration, etc. • If the reaction is:
OBVIOUS IMAGE PROBLEMS VLBA observations of SgrA* at 43 GHz This can’t be right. Either SgrA* has bidirectional jets that nobody else has ever seen or: Clear signs of problems: Image rms> expected rms Unnatural features in the image How can the problems be found and corrected? milliarcsec Miyoshi et al. 2005
HIGH QUALITY IMAGES Reality With care we can obtain good images. What were defects? Two antennas had ~30% calibration errors at low elevations. This part of the lecture. How to find the errors and remove them. milliarcsec
GENERAL PROCEDURE We assume that the data have been edited and calibrated reasonably successfully (earlier lectures) including self-calibration if necessary. So, the first serious display of an image leads one— • to inspect again and clean-up the data repeating some or all of the previous reduction steps. • removal of one type of problem can reveal next problem! • once all is well, proceed to image-analysis and obtaining scientific results from the image. But, first a digression on data and image display. First: Images
IMAGE DISPLAYS (1) Digital image Numbers are proportional to the intensity Old School
IMAGE DISPLAYS (2) • Profile Plot Contour Plot These plots are easy to reproduce and printed Contour plots give good representation of faint emission. Profile plots give a good representation of the bright emission.
IMAGE DISPLAYS (3) Color Display Grey-scale Display • Profile Plot Contour Plot TV-based displays are most useful and interactive: Grey-scale shows faint structure, but not good for high dynamic range and somewhat unbiased view of source Color displays more flexible; e.g. pseudo contours
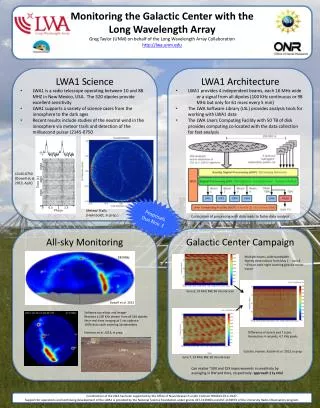
Movies and Radio Frequency Interference (RFI) Great pressure from wireless devices Need to "free-up" 500 MHz of spectrum Gigabit networks Dynamic allocation/Shared use of spectrum Passive use is still useful! LWA1 with ~210 antenna stands Likely changes: 1215 – 1300 MHz mobile comm. 1675 – 1710 MHz mobile comm. 1755 – 1850 MHz mobile comm. 2155 – 2200 MHz mobile comm 4200 – 4220 MHz altimeters 4380 – 4440 MHz altimeters 5925 – 7250 level-probing-radar 14000 – 14500 air to ground 15400 – 15700 radar 76000 – 77000 automobile radar
Movies and Solar Interference Heading into Solar Maximum so watch out for the Active Sun
Lightning Thunderstorm season on the Plains ...
DATA DISPLAYS(1) List of (u,v) Data Very primitive display, but sometimes worth-while: e.g. , can search on e.g. Amp > 1.0, or large weight. Often need precise times in order to flag the data appropriately.
DATA DISPLAYS(2) Visibility Amplitude versus Projected (u,v) spacing General trend of data. Useful for relatively strongsources. Triple source model. Large component cause rise at short spacings. Oscillations at longer spacings suggest close double. Jy Mega Wavelength
DATA DISPLAYS(3) Jy Deg Jy Deg Jy Deg Visibility amplitude and phase versus time for various baselines Good for determining the continuity of the data Should be relatively smooth with time Outliers are obvious. Long baseline • Short baseline Time in d/hh mm
DATA DISPLAYS(4) Weights of antennas 4 with 5,6,7,8,9 All (u,v) data points have a weight. The weight depends on the antenna sensitivity, measured during the observations The amplitude calibration values also modify the weights. Occasionally the weight of the points become very large, often caused by subtle software bugs. A large discrepant weight causes the same image artifacts as a large discrepant visibility value. Please check weights to make sure they are reasonable.
IMAGE PLANE OR DATA (U,V) PLANE INSPECTION? • Errors obey Fourier transformrelationship • Narrow feature in (u,v) plane <-> wide feature in image plane • Wide feature in (u,v) plane <-> narrow feature in image plane • Note: easier to spot narrow features • Data (u,v) amplitude errors <->symmetric image features • Data (u,v) phase errors <-> asymmetric image features • An obvious defect may be hardly visible in the transformed plane • A small, almost invisible defect may become very obvious in the transformed plane • Noise bumps can have sidelobes!
FINDING ERRORS • ---Obvious outlier data (u,v) points: • 100 bad points in 100,000 data points gives an 0.1% image error • (unless the bad data points are 1 million Jy) • LOOK at DATA to find grossproblem (you’d be hard pressed to find it in the image plane other than a slight increase in noise) • ---Persistent small data errors: • e.g. a 5% antenna gain calibration error is difficult to see • in (u,v) data (not an obvious outlier), but will produce a • 1% effect in image with specific characteristics (more later). • USE IMAGE to discover problem • ---Non-Data Problems: • Data ok, but algorithms chosen aren’t up to the task.
ERROR RECOGNITION IN THE (u,v) PLANE • Editing obvious errors in the (u,v) plane • ---Mostly consistency checks assume that the visibility cannot change much over a small change in (u,v) spacing • ---Also, look at gains and phases from calibration processes. These values should be relatively stable. • See Summer school lecture notes in 2002 by Myers • See ASP Vol 180, Ekers, Lecture 15, p321
VISIBILITY AMPLITUDE PLOTS Amp vs. time Amp vs. uvdist Amp vs. uvdist shows outliers Amp vs. time shows outliers in last scan Amp vs. time without ant 7 shows good data (3C279 VLBA data at 43 GHz) Amp vs. time, no ant 7
Example Edit – plotms(2) Fourier transform of nearly symmetric Jupiter disk Jansky bad Kilo-wavelength Butler lecture: Solar System Objects
Drop-outs at Scan Beginnings Often the first few points of a scan are low. E.g. antenna not on source. Software can remove these points (aips,casa ‘quack’) Flag extension: Should flag all sources in the same manner even though you cannot see dropout for weak sources
Editing Noise-dominated Sources No source structure information is detected. Noise dominated. All you can do is quack and remove outlier points above ~3sigma (0.3 Jy). Precise level not important as long as large outliers are removed.
USING TVFLG (VIEWER) DISPLAY on a source ANT-23 problems Plot amplitude rms <--Time quack these! Baseline-->
35 km 12 km 3 km baseline RFI Excision before after RFI environment worse on short baselines Several 'types': narrow band, wandering, wideband, ... Wideband interference hard for automated routines AIPS tasks FLGIT, FLAGR, SPFLG and CASA flagdata, mode=‘rfi’ Automation is crucial for WIDAR (wide band, lots of data) Time Frequency AIPS: SPFLG
ERROR RECOGNITION IN THE IMAGE PLANE Some Questions to ask: Noise properties of image: Is the rms noise about that expected from integration time? Is the rms noise much larger near bright sources? Are there non-random noise components (faint waves and ripples)? Funny looking Structure: Non-physical features; stripes, rings, symmetric or anti-symmetric Negative features well-below 4xrms noise Does the image have characteristics that look like the dirty beam? Image-making parameters: Is the image big enough to cover all significant emission? Is cell size too large or too small? ~4 points per beam okay Is the resolution too high to detect most of the emission?
EXAMPLE 1 Data bad over a short period of time Results for a point source using VLA. 13 x 5min observation over 10 hr. Images shown after editing, calibration and deconvolution. no errors: max 3.24 Jy rms 0.11 mJy 10% amp error for all antennas for 1 time period rms 2.0 mJy 6-fold symmetric pattern due to VLA “Y”. Image has properties of dirty beam.
EXAMPLE 2Short burst of bad data Typical effect from one bad antenna 20% amplitude error for one antenna at one time rms 0.56 mJy (self-cal) 10 deg phase error for one antenna at one time rms 0.49 mJy symmetric ridges anti-symmetric ridges
EXAMPLE 3Persistent errors over most of observations NOTE: 10 deg phase error to 20% amplitude error cause similar sized artifacts 10 deg phase error for one antenna all times rms 2.0 mJy 20% amp error for one antenna all times rms 2.3 mJy rings – odd symmetry rings – even symmetry
EXAMPLE 4Spurious Correlator Offset Signals Occasionally correlators produce ghost signals or cross talk signals Occurred during change-over from VLA to EVLA system Symptom: Garbage near phase center, dribbling out into image Image with correlator offsets Image after correction of offsets Jy
DECONVOLUTION ERRORS Even if the data are perfect, image errors and uncertainties will occur because the (u,v) coverage is not adequate to map the source structure. The extreme rise of visibility at the short spacings makes it impossible to image the extended structure. You are better of imaging the source with a cutoff below about 2 kilo-wavelengths Get shorter spacing or single-dish data
CLEANING WINDOW SENSITIVITY Tight Box Middle Box Big Box Dirty Beam One small clean One clean box Clean entire box around all emission inner map quarter Make box as small as possible to avoid cleaning noise interacting with sidelobes
How Deep to Clean? Under-cleaned Over-cleaned Properly cleaned Residual sidelobes dominate the noise Background is thermal noise-dominated; no "bowls" around sources. Regions within clean boxes appear "mottled" Emission from second source sits atop a negative "bowl"
Improvement of Image Removal of low level ripple improves detectability of faint sources Before editing After editing
Fourier Transform Dirty Image Shows the (u,v) data as gridded just before imaging Diagonal lines caused by structure in field A few odd points are not very noticeable
Fourier Transform Clean Image Shows the (u,v) data from clean image. Diagonal lines still present. Notice that clean does an interpolation in the u,vplane between u,vtracks. The odd points are smeared, but still present. These produce the low level ripples.
Bad weighting of a few (u,v) points After a long search through the data, about 30 points out of 300,000 points were found to have too high of a weight by a factor of 100. Effect is <1% in image. Cause?? Sometimes in applying calibration produced an incorrect weight in the data. Not present in the original data. These problems can sneak up on you. Beware.
Only MS-Clean Algorithm Choices SNR G55.7+3.4 1256, 1384, 1648, 1776 MHz
MS-Clean + W-Projection
MS-MFS + W-Projection + MS-Clean model
SUMMARY OF ERROR RECOGNITION • Source structure should be ‘reasonable’, the rms image noise • as expected, and the background featureless. If not, • (u,v) data • Look for outliers in (u,v) data using several plotting methods. • Check calibration gains and phases for instabilities. • Look at residual data (u,vdata - clean components) • IMAGE plane • Do defects resemble the dirty beam? • Are defect properties related to possible data errors? • Are defects related to possible deconvolution problems? • Are other corrections/calibrations needed? • Does the field-of-view encompass all emission?
IMAGE ANALYSIS • Input: Well-calibrated data-base producing a high quality image • Output: Parameterization and interpretation of image or a set of images This is very open-ended Depends on source emission complexity Depends on the scientific goals Examples and ideas are given. Many software packages, besides AIPS and Casa (e.g.. IDL, DS-9) are available.
IMAGE ANALYSIS OUTLINE • Multi-Resolution of radio source. • Parameter Estimation of Discrete Components • Image Comparisons • Positional Registration
IMAGE AT SEVERAL RESOLUTIONS Different aspect of source structure can be see at various resolutions, shown by the ellipse in the lower left corner of each box. SAME DATA USED FOR ALL IMAGES For example, Outer components are small from SU resolution There is no extended emission from low resolution • Natural Uniform Super-uniform Low Milli-arcsec
Imaging and Deconvolution of Spectral Line Data: Type of weighting in imaging HI contours overlaid on optical images of an edge-on galaxy
PARAMETER ESTIMATION Parameters associated with discrete components • Fitting in the image • Assume source components are Gaussian-shaped • Deep cleaning restores image intensity with Gaussian-beam • True size * Beam size = Image size, if Gaussian-shaped. Hence, estimate of true size is relatively simple. • Fitting in (u,v) plane (aka model-fitting) • Better estimates of parameters for simple sources • May be possible even when imaging is not • Can fit to more source models (e.g. Gaussian, ring, disk) • Error estimates of parameters • Simple ad-hoc error estimates • Estimates from fitting programs • Monte Carlo simulations if model-fitting
IMAGE FITTING AIPS task: JMFIT Casa tool imfit