Download
1 / 19
190 likes | 288 Views
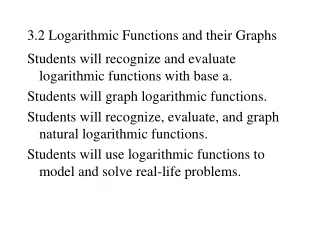
3.3 Logarithmic Functions and Their Graphs. We learned that, if a function passes the horizontal line test , then the inverse of the function is also a function. So, an exponential function f(x) = b x , has an inverse that is a function.

E N D
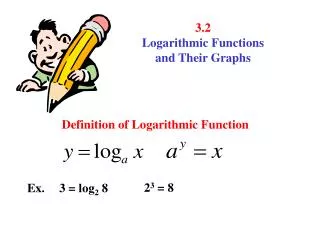
3.3 Logarithmic Functions and Their Graphs • We learned that, if a function passes the horizontal line test, then the inverse of the function is also a function. • So, an exponential function f(x) = bx, has an inverse that is a function. • This inverse is the logarithmic function with base b, denoted or .
Changing Between Logarithmic and Exponential Form • If x > 0 and 0 < b ≠ 1, then if and only if . • This statement says that a logarithm is an exponent. Because logarithms are exponents, we can evaluate simple logarithmic expressions using our understanding of exponents.
Evaluating Logarithms a.) because . b.) because . c.) because d.) because e.) because
Basic Properties of Logarithms • For 0 < b ≠ 1 , x > 0, and any real number y, • logb1 = 0 because b0 = 1. • logbb = 1 because b1 = b. • logbby = y because by = by. • because
Evaluating Logarithmic and Exponential Expressions (a) (b) (c)
Common Logarithms – Base 10 • Logarithms with base 10 are called common logarithms. • Often drop the subscript of 10 for the base when using common logarithms. • The common logarithmic function: y = log x if and only if 10y = x.
Basic Properties of Common Logarithms • Let x and y be real numbers with x > 0. • log 1 = 0 because 100 = 1. • log 10 = 1 because 101 = 10. • log 10y = y because 10y = 10y . • because log x = log x. • Using the definition of common logarithm or these basic properties, we can evaluate expressions involving a base of 10.
Evaluating Logarithmic and Exponential Expressions – Base 10 (a) (b) (c) (d)
Evaluating Common Logarithms with a Calculator • See example 4 p. 303
Solving Simple Logarithmic Equations • Solve each equation by changing it to exponential form: a.) log x = 3 b.) a.) Changing to exponential form, x = 10³ = 1000. b.) Changing to exponential form, x = 25 = 32.
Natural Logarithms – Base e • Because of their special calculus properties, logarithms with the natural base e are used in many situations. • Logarithms with base e are natural logarithms. • We use the abbreviation “ln” (without a subscript) to denote a natural logarithm.
Basic Properties of Natural Logarithms • Let x and y be real numbers with x > 0. • ln 1 = 0 because e0 = 1. • ln e = 1 because e1 = e. • ln ey = y because ey = ey. • eln x = x because ln x = ln x.
Evaluating Logarithmic and Exponential Expressions – Base e (a) (b) (c)
Transforming Logarithmic Graphs • Describe how to transform the graph of y = ln x or y = log x into the graph of the given function. a.) g(x) = ln (x + 2) The graph is obtained by translating the graph of y = ln (x) two units to the LEFT.
Transforming Logarithmic Graphs • Describe how to transform the graph of y = ln x or y = log x into the graph of the given function. b.) h(x) = ln (3 - x) The graph is obtained by applying, in order, a reflection across the y-axis followed by a transformation three units to the RIGHT.
Transforming Logarithmic Graphs • Describe how to transform the graph of y = ln x or y = log x into the graph of the given function. c.) g(x) = 3 log x The graph is obtained by vertically stretching the graph of f(x) = log x by a factor of 3.
Transforming Logarithmic Graphs • Describe how to transform the graph of y = ln x or y = log x into the graph of the given function. d.) h(x) = 1+ log x The graph is obtained by a translation 1 unit up.
Measuring Sound Using Decibels • The level of sound intensity in decibels (dB) is where (beta) is the number of decibels, I is the sound intensity in W/m², and I0 = 10 – 12 W/m² is the threshold of human hearing (the quietest audible sound intensity).
More Practice!!!!! • Homework – Textbook p. 308 #2 – 52 even.