Download
1 / 9
90 likes | 97 Views
A simple and accurate ion chromatographic method was developed for the determination of<br>sulfate content in presence of glutaric acid in (1S, 4R)-4- [2- amino- 6- (cyclopropyl amino) - 9<br>H- purin- 9-yl]-2- cyclopentene- 1-methanol hemisulfate, commercially known as Abacavir hemisulfate drug substance

E N D
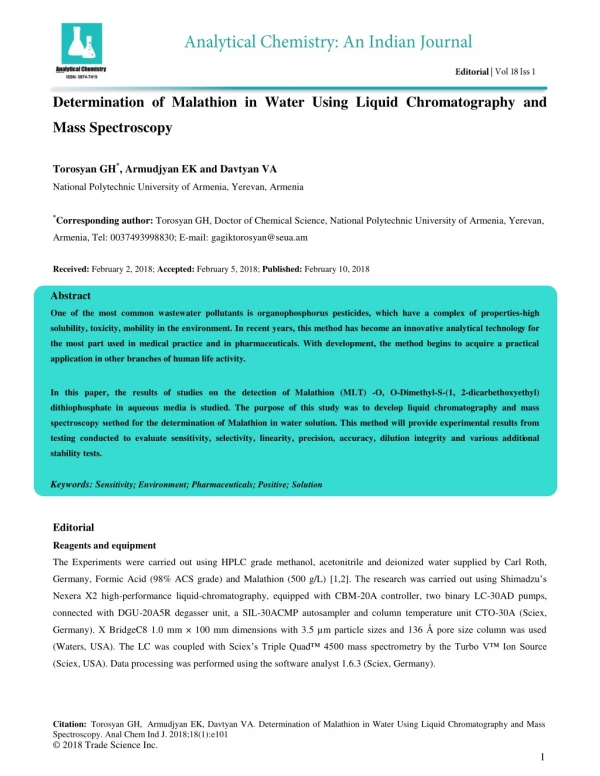
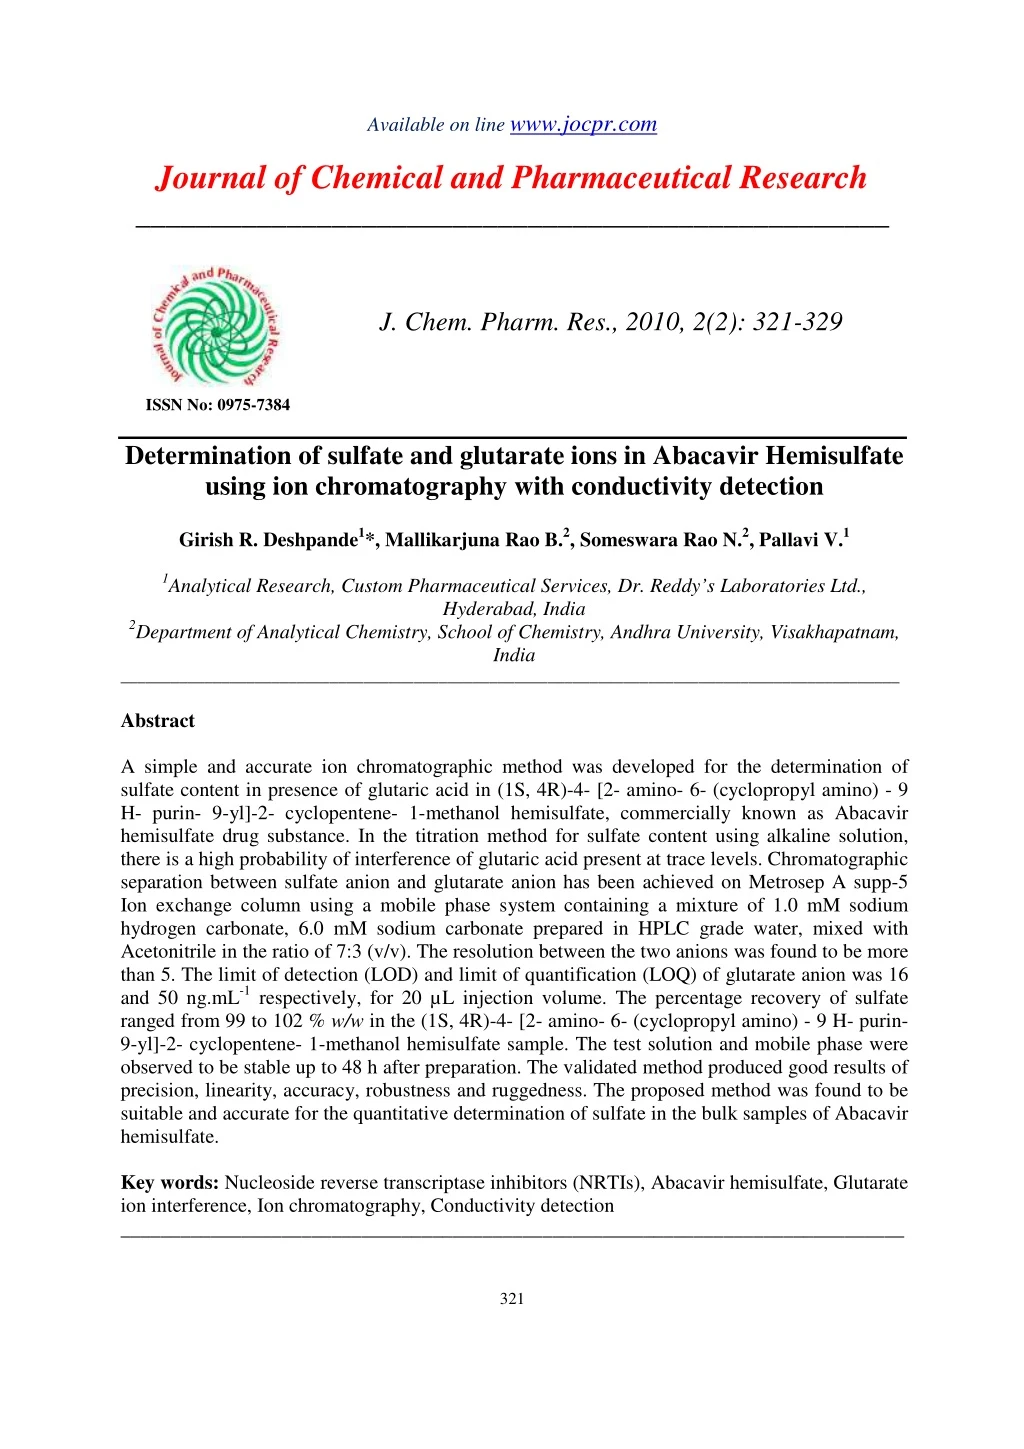
Available on line www.jocpr.com Journal of Chemical and Pharmaceutical Research __________________________________________________ J. Chem. Pharm. Res., 2010, 2(2): 321-329 ISSN No: 0975-7384 Determination of sulfate and glutarate ions in Abacavir Hemisulfate using ion chromatography with conductivity detection Girish R. Deshpande1*, Mallikarjuna Rao B.2, Someswara Rao N.2, Pallavi V.1 1Analytical Research, Custom Pharmaceutical Services, Dr. Reddy’s Laboratories Ltd., Hyderabad, India 2Department of Analytical Chemistry, School of Chemistry, Andhra University, Visakhapatnam, India _____________________________________________________________________________________________ Abstract A simple and accurate ion chromatographic method was developed for the determination of sulfate content in presence of glutaric acid in (1S, 4R)-4- [2- amino- 6- (cyclopropyl amino) - 9 H- purin- 9-yl]-2- cyclopentene- 1-methanol hemisulfate, commercially known as Abacavir hemisulfate drug substance. In the titration method for sulfate content using alkaline solution, there is a high probability of interference of glutaric acid present at trace levels. Chromatographic separation between sulfate anion and glutarate anion has been achieved on Metrosep A supp-5 Ion exchange column using a mobile phase system containing a mixture of 1.0 mM sodium hydrogen carbonate, 6.0 mM sodium carbonate prepared in HPLC grade water, mixed with Acetonitrile in the ratio of 7:3 (v/v). The resolution between the two anions was found to be more than 5. The limit of detection (LOD) and limit of quantification (LOQ) of glutarate anion was 16 and 50 ng.mL-1 respectively, for 20 µL injection volume. The percentage recovery of sulfate ranged from 99 to 102 % w/w in the (1S, 4R)-4- [2- amino- 6- (cyclopropyl amino) - 9 H- purin- 9-yl]-2- cyclopentene- 1-methanol hemisulfate sample. The test solution and mobile phase were observed to be stable up to 48 h after preparation. The validated method produced good results of precision, linearity, accuracy, robustness and ruggedness. The proposed method was found to be suitable and accurate for the quantitative determination of sulfatein the bulk samples of Abacavir hemisulfate. Key words: Nucleoside reverse transcriptase inhibitors (NRTIs), Abacavir hemisulfate, Glutarate ion interference, Ion chromatography, Conductivity detection ______________________________________________________________________________ 321
Girish R. Deshpandeet al J. Chem. Pharm. Res., 2010, 2(2): 321-329 _____________________________________________________________________________ Introduction Virtually all the compounds that are currently used or are subject of advanced clinical trials for the treatment of HIV infections belong to one of the following classes: nucleoside reverse transcriptase inhibitors (NRTIs) and non-nucleoside reverse transcriptase inhibitors (NNRTIs) [1]. Abacavir is a carbocyclic 2'-deoxyguanosine nucleoside reverse transcriptase inhibitor that is used as either a 600-mg once-daily or 300-mg twice-daily regimen exclusively in the treatment of human immunodeficiency virus (HIV) infection [2]. Abacavir is a carbocyclic nucleoside analogue with inhibitory activity against HIV. Initially, Abacavir is phosphorylated to its corresponding monophosphate as intracellular reaction. Cytosolic enzymes convert Abacavir monophosphate to carbovir monophosphate (CBV-MP), which is finally phosphorylated to the biologically active moiety, carbovir triphosphate (CBV-TP). CBV-TP inhibits HIV reverse transcriptase by competing with the endogenous substrate dGTP and by chain termination subsequent to incorporation into the growing polynucleotide strand [3]. It is chemically known as (1S, 4R)-4- [2- amino-6-(cyclopropyl amino)-9 methanolhemisulfate and is being prepared by condensation of (1S, 4R)-cis-4-[2-amino-6-chloro- 9H-purin-9-yl]-2-cyclopentene-1-methanol and cyclopropyl amine. During preparation of Abacavir hemisulfate, various purification procedures are tried to achieve the impurity profile as per ICH requirements. One of the purification procedures employs preparation of glutarate salt of Abacavir crude followed by free base generation. This free base is further treated with sulfuric acid solution to prepare a hemisulfate salt of Abacavir. During this process, there is possibility of trace levels of contamination of glutaric acid in free base and hemisulfate salt. There are titration methods reported for sulfate content using particular normal alkaline solution. The residual levels of glutaric acid may interfere in the quantitative determination of sulfate content in Abacavir hemisulfate in the titration methods. Several trials were performed to quantitate sulfate and glutarate ions separately by titration. No successful results were obtained. Hence it is important to develop a specific and accurate method for the quantitative determination of sulfate content in Abacavir hemisulfate. To our present knowledge no Ion chromatography (IC) method was reported in the literature for the separation of sulfate ions from glutarate ions. The present research work is focused on the development of simple and accurate ion chromatographic method for the separation of sulfate and glutarate ions by using Metrosep A supp-5 column and detection on suppressed conductivity detector. Experimental Section The objective of this work is to accurately quantify the salt forming agent i.e. sulfate ion of Abacavir hemisulfate in presence of residual level of glutaric acid. Initially various trials were performed to quantify sulfate and glutarate ions by titration methods. The test sample of Abacavir sulfate was titrated against the 0.1 N sodium hydroxide solution using potentiometer. Then it was spiked by known amount of glutaric acid to check the potential difference between two anions. No successful results were obtained. Similarly the mixture of glutaric acid and Abacavir sulfate were titrated against various organic and inorganic base titrants to differentiate between two anions. These trials along with corresponding results are tabulated in table-1. H- purin-9-yl]-2-cyclopentene-1- 322
Girish R. Deshpandeet al J. Chem. Pharm. Res., 2010, 2(2): 321-329 _____________________________________________________________________________ Table -1:Results of various titration trials Titration conditions Trial No. Remarks Weight of sample: 200 mg; Titrant: 0.1 N NaOH Indicator: Phenolphthalein; sample spiked with 50 mg of glutaric acid Weight of sample: 200 mg; Titrant: 0.1 N NaOH Potentiometer-cum-autotirator; sample spiked with 50 mg of glutaric acid Weight of sample: 200 mg; Titrant: 0.1 N NaHCO3 Potentiometer-cum-autotirator; sample spiked with 50 mg of glutaric acid Weight of sample: 200 mg; Titrant: 0.1 N Tetra methyl ammonium hydroxide Potentiometer-cum-autotirator; sample spiked with 50 mg of glutaric acid Manual titration; single end point observed; No differentiation between two acids end points No potential difference observed for two acids; final result was sum of moles of two acids No potential difference observed for two acids; final result was sum of moles of two acids No potential difference observed for two acids 1 2 3 4 Table - 2:Results of various trials on Ion chromatography Chromatographic conditions Trial No. Remarks Column: Metrosep A Supp 5 column (250 x 4.0 mm, 5.0µm Particle size); Mobile phase: 6 mM Na2CO3 in de-ionized water, Flow Rate : 0.8mLmin-1, Detector : UV (210 nm), Injection volume: 10 µL Column: Metrosep A Supp 5 column (250 x 4.0 mm, 5.0µm Particle size); Mobile phase: 6 mM Na2CO3 in de-ionized water, Flow Rate : 0.8mLmin-1, Detector : Conductivity with cation suppresor, Injection volume: 20 µL Column: Metrosep A Supp 5 column (250 x 4.0 mm, 5.0µm Particle size); Mobile phase: 1 mM NaHCO3 + 6 mM Na2CO3 in de-ionized water, Flow Rate : 0.8mLmin-1, Detector : Conductivity with cation suppresor, Injection volume: 20 µL Column: Metrosep A Supp 5 column (250 x 4.0 mm, 5.0µm Particle size); Mobile phase: 1 mM NaHCO3 + 6 mM Na2CO3 in de-ionized water, Flow Rate : 0.6 mLmin-1, Detector : Conductivity with cation suppresor, Injection volume: 20 µL Column: Metrosep A Supp 5 column (250 x 4.0 mm, 5.0µm Particle size); Mobile phase: Mixture of 1 mM NaHCO3 + 6 mM Na2CO3 in de- ionized water, mixed with acetonitrile (7:3 v/v), Flow Rate : 0.6 mLmin-1, Detector : Conductivity with cation suppresor, Injection volume: 20 µL Very less response was observed for both sulfate and glutarate ions 1 Good response was observed for both sulfate and glutarate ions; but no separation was observed 2 Retention improved but no separation observed 3 Retention increased but no separation observed; Also peak shapes were broadened 4 Retention separation between two ions; Also peak shapes were improved decreased with good 5 Based on above trials, it was decided to opt for a specific, accurate and precise analytical tool for this quantification. Ion chromatography is a well known technique to quantify various ions from mixture. There was no literature observed which describes the methodology differentiating these two specific anions. Initially trials were performed by using ion-exchange column and UV detector on a routine HPLC instrument. Due to less response of glutaric acid and sulfate standard 323
Girish R. Deshpandeet al J. Chem. Pharm. Res., 2010, 2(2): 321-329 _____________________________________________________________________________ in UV detector, the development was carried on conductivity detector. Conductivity detector was connected with cation suppressor to minimize the noise in baseline due to mobile phase components. A blend solution having mixture of sulfate standard and glutaric acid standard was injected in a HPLC instrument to separate these two ions. Sodium sulfate was used as a sulfate standard for this study. Mobile phase was prepared using sodium hydrogen carbonate and sodium carbonate mixture in water, mixed with acetonitrile solvent. Various trials along with respective results are summarized in table-2. Table - 3: System suitability test results Name Retention time Resolution(Rs) (tR) in min by Tangent factor (T) method (USP) Glutarate ion 18.8 - Sulfate ion 21.4 6.5 Materials and methods 3.1. Chemicals and Reagents Samples of (1S, 4R)-4- [2- amino- 6- (cyclopropyl amino) - 9 H- purin- 9-yl]-2- cyclopentene- 1- methanol hemisulfate (Abacavir hemisulfate) were received from Process Research Department of Custom Pharmaceutical Services, a business unit of Dr. Reddy’s Laboratories Ltd., Hyderabad, India. Analytical grade sodium carbonate and sodium hydrogen carbonate were purchased from S.D.fine chemicals, Mumbai, India. Analytical reagent grade sulfuric acid was purchased from Merck, Mumbai, India. Analytical reagent grade glutaric acid and sodium sulfate were purchased from Qualigens Fine Chemicals, Mumbai, India. HPLC grade water was produced by Milli-Q water purification system in the laboratory. 3.2. Instrumentation The Ion Chromatography system purchased from Metrohm, Herisau, Switzerland used through out this study, which is equipped with 818 IC pump, 833 Liquid Handling unit, Sample injector with 20µL loop, 820 IC Separation center equipped with a Cation suppressor and Conductivity detector. Quantitation was performed from the output signal, monitored and processed using the IC Net 2.3 SR4 version software on Compaq computer (Digital Equipment Co). Dilutions were accomplished with Hamilton precision pipettes (Bonaduz, Switzerland) 3.3. Standard and Sample preparation The stock solutions of glutaric acid and sodium sulfate were prepared separately by dissolving the appropriate amounts of the substances in diluent. These stock solutions were diluted further to prepare the mixture of glutarate and sulfate ions at 0.15% and 13.6% respectively with respect to analyte concentration. The concentration for sulfate ion was fixed based on the theoretical concentration or molecular weight correction in Abacavir hemisulfate, whereas concentration for glutaric acid was fixed considering ICH specification limit for a known impurity with respect to USP Tailing 1.6 1.4 324
Girish R. Deshpandeet al J. Chem. Pharm. Res., 2010, 2(2): 321-329 _____________________________________________________________________________ analyte concentration [5]. The test sample solution was prepared separately in diluent. The target analyte concentration was fixed as 0.2 mg mL-1. Results and Discussion 4.1. Optimized method conditions Chromatographic separations were achieved on Metrosep A Supp 5 column (250 x 4.0 mm, 5.0µm Particle size) having stationary phase of Polyvinyl alcohol with Quaternary Ammonium groups, that was safeguarded with Metrosep A Supp 4/5 guard column. The mobile phase used was a mixture of 1.0 mM sodium hydrogen carbonate, 6.0 mM sodium carbonate prepared in HPLC grade water, mixed with Acetonitrile in the ratio of 7:3 (v/v). Mobile phase was degassed and filtered after mixing the solvents. The flow rate of the mobile phase was set at 0.6 ml/min. The injection volume was 20 µL. Water was used as a diluent. The test sample concentration was 0.2 mg mL-1 in diluent. The column temperature was maintained at 25 °C and the detection was done using conductivity detector. The total analysis time for each run was about 30 min. Good separation was observed on between sulfate and glutarate ions (Resolution > 5.0). Typical retention times of glutarate ion and sulfate ion were 18.8 and 21.4 min, respectively (Fig. 2). The system suitability [4] results were presented in table-3. Fig–1: Chemical structure of Abacavir hemisulfate NH N HN 0.5 H2SO4 N H2N N OH The anion exchange chromatographic system is equipped by a cation exchange resin suppressor for chemical suppression. Chemical suppression reduces the background conductivity and replaces the counter ions in the sample i.e. all cation from the mobile phase are replaced by H+. By this suppression reaction, an eluent with high conductivity is transferred to water and carbon di-oxide which is of low conductivity. Suppressor is regenerated after each run using a suppressor regenerator followed with suppressor rinsing with HPLC grade water. Suppressor regenerator used is 50 mM sulfuric acid prepared in HPLC grade water. The detector interface was set with detector range 100µS/cm and detector full scale 20 µS/cm 325
Girish R. Deshpandeet al J. Chem. Pharm. Res., 2010, 2(2): 321-329 _____________________________________________________________________________ Fig-2:Typical chromatograms representing the blank (diluent), mix standard at specification level, test sample and zoomed glutarate peak mV 150 100 Blank (Diluent) 50 0 ch1 -50 -100 0 2 4 6 8 10 12 14 16 18 20 22 S u lp h a t e 24 26 min mV 50 Mix standard of glutarate and sulfate ions 40 30 20 G lu ta r a te 10 0 ch1 -10 0 2 4 6 8 10 12 14 16 18 20 22 S u lp h a t e 24 26 min mV 50 Abacavir sulfate test sample 40 30 20 G lu ta r a te 10 0 ch1 -10 0 2 4 6 8 10 12 14 16 18 20 22 24 26 min mV G lu ta rate -1.5 ch1 -2.0 -2.5 15 16 17 18 min By using optimized conditions, the method was checked for various validation parameters. It was observed that the method has met all the acceptance criteria as per regulatory requirements. The details of validation parameters and corresponding results are mentioned below. 326
Girish R. Deshpandeet al J. Chem. Pharm. Res., 2010, 2(2): 321-329 _____________________________________________________________________________ 4.2. Method Validation 4.2.1. Precision: The precision of an analytical procedure expresses the closeness of agreement among a series of measurements obtained from multiple samplings of the same homogenous sample under prescribed conditions [6]. The system and method precision for glutarate and sulfate ions were checked at 0.15% and 13.6% respectively with respect to analyte concentration, which is 0.2 mg mL-1. The percentages RSD of system repeatability for glutarate and sulfate ions were observed to be 2.6 and 0.54, respectively. The percentages RSD of method repeatability for glutarate and sulfate ions were observed to be 3.1 and 0.68 respectively. It confirms good precision of the method. 4.2.2. Linearity: The linearity of an analytical procedure is its ability (within a given range) to obtain test results, which are directly proportional to the concentration of the analyte in the sample [6]. The linearity of the method for glutarate ion was checked at six concentration levels i.e. from LOQ to 150 % of specification level. The linearity of the method for sulfate ion was checked separately at six concentration levels i.e. from 25% to 150 % of specification level. The coefficient of regression of the calibration curve was found to be 0.9992 and 0.9999 for glutarate and sulfate ions respectively, thus confirming the excellent correlation existed between the peak area and concentration. The linearity plots are represented in fig-3. Fig-3:Linearity plots for sulfate ion and glutarate ions respectively Linearity plot of Sulfate ion Linearity plot of Glutarate ion 25000.000 10.000 9.000 y = 505.69x - 89.843 R2 = 0.9999 y = 20.131x + 0.0208 R2 = 0.9992 20000.000 8.000 7.000 6.000 15000.000 Area Area 5.000 4.000 10000.000 3.000 2.000 5000.000 1.000 0.000 0.000 0.000 0.100 0.200 0.300 0.400 0.500 0.000 5.000 10.000 15.000 20.000 25.000 30.000 35.000 40.000 45.000 Concentration (ppm) Concentration (ppm) Area Linear (Area) Area Linear (Area) 4.2.3. Limit of Detection and Limit of Quantification: The limit of detection and limit of quantitation for glutarate ion were established as it is considered to be an impurity in drug substance. The limit of detection (LOD) represents the concentration of analyte that would yield a signal to noise ratio of 3 [6]. The limit of detection for glutarate ion was observed to be 80 µg mL-1for 20 µL of injection volume. The limit of quantification (LOQ) represents the concentration of analyte that would yield a signal to noise ratio of 10. The limit of quantification for glutarate ion was observed to be 250 µg.mL-1. The injection volume was 20 µL. 327
Girish R. Deshpandeet al J. Chem. Pharm. Res., 2010, 2(2): 321-329 _____________________________________________________________________________ 4.2.4. Recovery of glutarate and sulfate ions in bulk sample: Standard addition and recovery experiments were conducted to determine the accuracy of the present method, for the quantification of glutarate and sulfate ions in samples of Abacavir hemisulfate. The study was carried out at 50%, 100% and 150% with respect to specification. The percentage recoveries of glutarate ions were ranged from 98.6 to 102.4, whereas for sulfate ions the values were 99.2 to 100.7. 4.2.5. Ruggedness: The ruggedness of a method was defined as degree of reproducibility of results obtained by analysis of the same sample under variety of normal test conditions such as different laboratories, different analysts, different instruments, different days and different lots of reagents. In this case the study was performed by different analysts on different days. Precision studies were carried out for glutarate and sulfate content in bulk samples at the same concentration levels tested by different analysts on different days. The results obtained by second analyst on second day were well in agreement with the results obtained in initial analysis. 4.2.6. Solution stability and mobile phase stability Solution stability was studied by keeping the test solution in tightly capped volumetric flask at room temperature (25+2o C) on a laboratory bench for 48 h. Content of glutarate and sulfate ions were checked for every 12 h interval and compared with freshly prepared solution. No variation was observed in the study period and it indicates that Abacavir hemisulfate sample solutions prepared in diluent were stable up to 48 h at room temperature (25+2o C) with respect to specified method. The mobile phase stability experiments data confirms, no variation was observed in the study period and it indicates prepared mobile phase was found to be stable up to 48 h at room temperature (25+2o C). Conclusion The new simple Ion chromatographic method developed for the quantitative determination of sulfate ions in presence of glutaric acid in Abacavir hemisulfate is precise, accurate and linear. The method was completely validated showing satisfactory data for all the method validation parameters tested. It also proves that the mixture of two ions like Sulfate and glutarate can be separated with better accuracy than titration analysis. The developed method can be used for the quantitative determination of sulfate content in Abacavir hemisulfate samples with or without presence of glutaric acid. Acknowledgments The authors wish to thank the management of Dr. Reddy’s group for supporting this research work. Authors wish to acknowledge the Process research group especially P. Mahesh Kumar for providing the samples for our research. References [1]E. De Clercq , Med Res Rev., 2002, 22(6): 531-65 [2]GJ Yuen , S Weller, GE Pakes, Clin Pharmacokinet. 2008, 47 (6):351-71 [3]JR Huff, Bioorganic & Medicinal Chemistry 7, 1999; 2667-2669 328
Girish R. Deshpandeet al J. Chem. Pharm. Res., 2010, 2(2): 321-329 _____________________________________________________________________________ [4]United States Pharmacopeia (2008). [5]International Conference on Harmonization tripartite guideline, Q3A (R2) Current Step 4 Version, Impurities in new drug substances, October 2006 [6]International Conference on Harmonization tripartite guideline Q2R1, Validation of Analytical Procedures: Text and Methodology”, November 2005 329