Download
1 / 16
160 likes | 245 Views
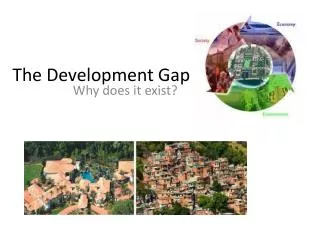
The Development Gap. Measures of Development. GNP Gross National Product – it shows how wealthy (rich) a country is. It dos not take account of some taxes. GNP per head (capita) of USA is $43,743 and Bangladesh is $467.

E N D
Measures of Development GNP Gross National Product – it shows how wealthy (rich) a country is. It dos not take account of some taxes. GNPper head(capita) of USA is $43,743 and Bangladesh is $467. GNI Gross NationalIncome measures the amount of money a country earns and it shows how rich a country is. GNI per head(capita) measures the average amount of money each person earns before tax. GNI per capita in USA is $44,710 and in Bangladesh is $480. BR Birth rates – the more developed a country, the lower the birth rate. CBR – Crude Birth Rate – number of babies born per 1000 people per year. Japan has a BR of 8.3. Ivory Coast has a BR of 35.3. HDI Human Development Index is an index based on 3 variables: life expectancy at birth; level of education, including both literacy rate and years spent in school; income adjusted for purchasing power. Japan (a rich country) had a HDI of 0.949. Ivory Coast ( a poor country) has an HDI of 0.421. DR Death rates – the more developed a country, the lower the death rate. CDR Crude Death Rate – number of deaths per year per 1000 people. Japan has a DR of 9.0. Ivory Coast has a DR of 15.4.
Measures of Development Infant mortality – the number of babies (12 months) dying per 1000 live births. Japan has an infant mortality of 3 and Ivory Coast has 118. People per doctor – the number of doctors per 1,000 people. USA has 2.6 per 1000 and Ivory Coast has 0.1 per 1000. Literacy Rate %: the % of people who can read and write. USA has a literacy rate of 100% and Bangladesh has a rate of 47.5%. Access to safe water % - the % of people with access to clean water. In UK there is 100% access but in Bangladesh it is 74%. Life expectancy; the number of years a person can expect to live, usually taken from birth. Japan has a life expectancy of 82.6 and Swaziland of 39.6.
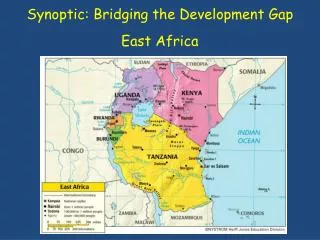
You have to understand choropleth maps which have different colours to show different categories.
Correlation between the different measures As a country becomes more developed the standard of living as measured by the whole range of indicators rises. So countries should aim to develop in order to lift their people out of poverty. Negative correlation between birth rate and GNI. As the birth rate increases the poorer the country becomes. Positive correlation between birth rates and infant mortality. As birth rates increase so does the infant mortality rate. Development means improving the economy (more jobs), improving living conditions (social factors) and improving the environment (cleaner air, water and land) Other positive correlations: GNP + GNI; GNP + HDI; GNP + number of doctors; GNP + literacy rate; GNP + access to clean water
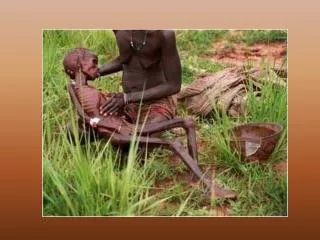
Limitations/ways of using a single development measure Birth rates are an excellent measure of development – they show that living standards have risen for women in particular. Death rates are a poor indicator of development as death rates can be low because of a youthful population structure not high living standards. GNP and GNI are a confusing way of showing how developed a country is because they do not tell us how happy or satisfied people are. Using only one indicator is not enough as it doesn’t tell us what is going on in a country and it can mask huge differences between the rich and poor because it is an average figure.
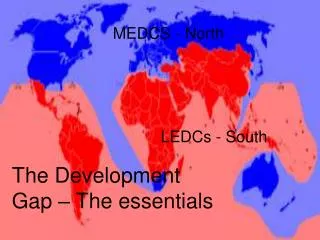
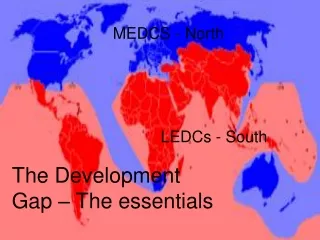
Different ways of classifying the world MEDC – More Economically Developed country LEDC – Less Economically Developed Country NICs – Newly Industrialised Country North/South North – wealthy and industrialised countries. South – poorer, less mature and more agricultural First, second, third and fourth worlds. 1st – Europe 2nd - North America & Australia 3rd – Poor countries e.g. India 4th – Very poor countries e.g. Somalia Wealth – five fold division 1 – rich industrialised countries 2. oil-exporting countries 3. Newly industrialising countries 4. Former communist countries 5. Heavily indebted poorer countries
Relationship between quality of life and the standard of living Different perceptions on what makes an acceptable quality of life varies around the world. In some countries people are happy with fewer consume durables and believe that family and friend are more important than possessions. In hot countries, people can live outdoors and so require less from their housing and fewer clothes. In poorer countries people are trying to improve their own quality of life through education and better health care. What is better?
Global inequalities – factors affecting • Human Factors • Rich countries tend to have • Well educated people • Good health systems • Welfare systems & benefits • Better economies so more jobs and opportunities • Lower population growth • Poorer countries tend to have • Higher population growth • More unstable governments • Physical factors • Rich countries tend to have • Coastlines so trade is easy • Temperate climates • Fewer climatic hazards e.g. hurricanes • Fewer climate related diseases e.g. malaria • Poor countries tend to be • Land locked so trade is difficult • Tropical climates and diseases • Many climatic hazards e.g. drought Economic factors – global imbalance of trade between different parts of the world. Environmental factors: the impact of natural hazards. Social factors – differences in the quantity and quality of water Political influences – the impact of unstable governments e.g. war, unrest, strife.
Case Study of a natural hazard Hurricane Ivan – Grenada 2004 Very powerful hurricane hit the Caribbean island of Grenada in September 2004. Huge damage. 90% of homes destroyed. Long term damage to the development of the island occurred. Tourism, the major industry was severely affected.
World Trade • Ways of reducing imbalances in world trade: • Fair Trade • Trading Groups • Debt abolition • Conservation swaps • Aid • Sustainable development The rich countries protect their own industries by imposing tariffs and quotas. Tariffs are government taxes on imported or exported goods. Poor countries find it hard to compete in the world market. • Trading Groups • The European Union • Mercosur South America • NAFTA: The North • American Free Trade Association Fair Trade It is an organisation that sets standards for trade with LEDC’s. It guarantees a fair price for the farmer. This pays for the product and investment in local community development projects. In return the farmer must farm in an environmentally friendly way and treat their workers fairly too.
Debt and Aid The reduction in debt repayments through debt abolition and conservation swaps. A conservation swap is an agreement between a rich country and a poor country. The poor country agrees not to clear its tropical rainforest in return for its debts to be written off. Debt abolition is when a rich country wipes out the money that the poor country owes it.
Sustainable Development The role of international aid donors in encouraging sustainable development. UK Aid - We help the world's poorest people to lift themselves out of poverty. We help ‘fragile states’ e.g. Sudan, Ethiopia, Afghanistan, Bangladesh and the Democratic Republic of Congo, where citizens often cannot rely on services such as water, education and justice. We support governments committed to tackling poverty, upholding human rights, managing public money wisely, tackling corruption and be open and honest in how they govern.
Case Study of a development project Cahora Bassa dam, Mozambique The Cassa Borara dam was begun by the Portuguese government of Mozambique in the 1960s and it was finished in 1997. It is a huge HEP schemes with 3 major dams along the River Zambezi. The Cassa Bassa dam is the most important and the lake behind it is huge. Most often power is sold to South Africa and does not benefit the local people. It could provide electricity for the whole of Mozambique. It has caused huge environmental damage. The shrimp industry has been destroyed. It could be successful. An example of a development large scale bilateral aid project (aid given by one country to another).
The EU has big disparities in development Some EU regions are poor e.g. Southern Italy Some EU regions are rich e.g. South-east England Some EU countries are poor e.g. Romania Some EU countries are rich e.g. Germany Even in rich countries some parts are poor The most prosperous regions in terms of GDP per capita (the standard measure of wellbeing) are all urban – London, Brussels and Hamburg. The wealthiest country, Luxembourg, is more than seven times richer than Romania and Bulgaria, the poorest and newest EU members. Why are there these differences? geographic remoteness recent social and economic change a combination of both. The impact of these disadvantages is frequently evident in social deprivation, poor quality schools, higher joblessness and inadequate infrastructures. In the case of some EU states, part of the handicap is a legacy of their former centrally-planned economic systems
How is the EU reducing the gap? Regional development policy: the EU transfers resources from affluent to poorer areas. The aim is to modernise backward regions so that they can catch up with the rest of the Union The European Regional Development Fund (ERDF) - general infrastructure, innovation, and investments. The European Social Fund (ESF) - vocational training projects and job-creation programmes. The Cohesion Fund - environmental and transport infrastructure projects and renewable energy. Urban II Fund The economic and social regeneration of cities and neighbourhoods in crisis in order to promote sustainable urban development. Improving 70 cities in the EU – buildings, transport, environment, communities. Urban regeneration e.g. Belfast. CAP – Common Agricultural Policy: Farmers get subsidies for food production Quotas are set for key products e.g. milk, beef Farmers paid to keep land in good condition and look after animals properly Food prices are now high in EU Farmers paid to ‘set aside’ land