Download
1 / 25
250 likes | 372 Views
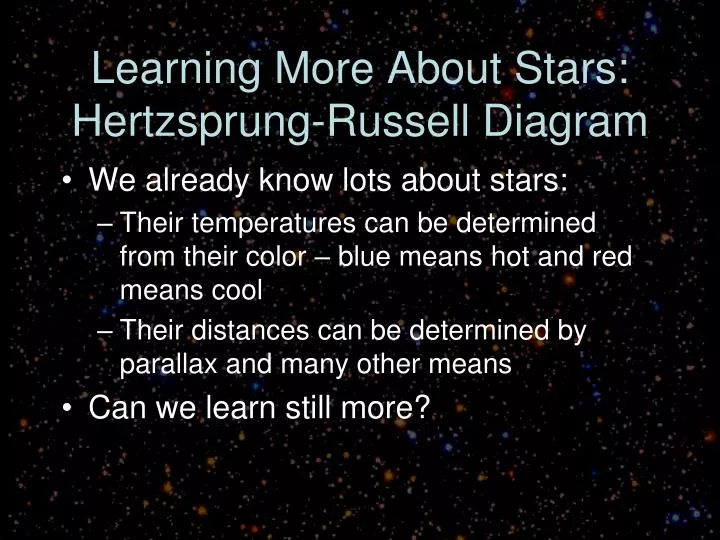
Learning More About Stars: Hertzsprung-Russell Diagram. We already know lots about stars: Their temperatures can be determined from their color – blue means hot and red means cool Their distances can be determined by parallax and many other means Can we learn still more?.

E N D
Learning More About Stars: Hertzsprung-Russell Diagram • We already know lots about stars: • Their temperatures can be determined from their color – blue means hot and red means cool • Their distances can be determined by parallax and many other means • Can we learn still more?
Making charts can be power • We can use charts to draw conclusions about things unseen. • Let’s consider charting weights and heights for a group of students.
Making the chart… • Draw a set of X-Y axes • On the X-axis, place weight with 0 lbs to the left and 200 lbs to the right • On the Y-axis, place height with 0 ft at the bottom and 7 ft at the top
Your chart should look like this • Draw a set of X-Y axes • On the X-axis, place weight with 0 lbs to the left and 300 lbs to the right • On the Y-axis, place height with 0 ft at the bottom and 7 ft at the top
What can you infer about “5”? • Draw a set of X-Y axes • On the X-axis, place weight with 0 lbs to the left and 300 lbs to the right • On the Y-axis, place height with 0 ft at the bottom and 7 ft at the top 5
Making inferences • You can tell that person 5 is in some way different from the rest of the people • You can tell from the data that person 5 is very tall for the indicated weight. • You can infer that someone who is very tall and weighs very little is…
Conclusions • You should have concluded the person 5 is very slender, even thin compared to the “main sequence” of other persons. • What would you conclude if someone on the chart’s position was below the “main sequence” of other people?
And so it is with stars • Astronomers have learned that if they make similar charts for stars (luminosityversus temperature), they can draw certain conclusions about stars too much like we have just done with humans! We don’t need to see stars “close up” in order to infer.
10.0 Luminosity vs Temperature
10.1 Separate stars by temperature
10.2 Separate stars by temperature
10.3 Separate stars by temperature
10.4 Separate stars by temperature
10.5 Separate stars by temperature
10.6 Separate stars by temperature
10.7 Separate stars by temperature
10.7 Now, separate by luminosity
10.8 Separate stars by luminosity
10.9 Separate stars by luminosity
10.10 Separate stars by luminosity
10.11 Separate stars by luminosity
10.12 Separate stars by luminosity
10.13 Separate stars by luminosity
10.14 H-R Diagram: Inferring Size 3) Red Giant Branch 4) Horizontal Branch 5) White Dwarf Sequence 1) Main Sequence 2) SubGiant Branch