Download
1 / 17
170 likes | 219 Views
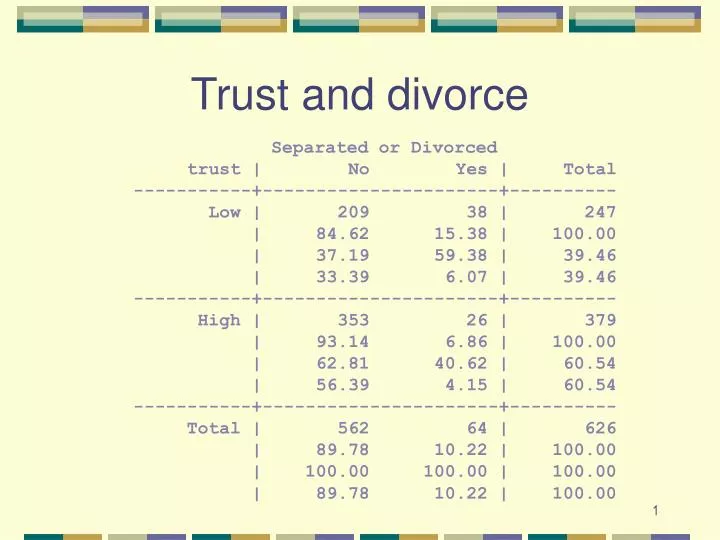
Trust and divorce. Separated or Divorced trust | No Yes | Total -----------+----------------------+---------- Low | 209 38 | 247 | 84.62 15.38 | 100.00 | 37.19 59.38 | 39.46

E N D
Trust and divorce Separated or Divorced trust | No Yes | Total -----------+----------------------+---------- Low | 209 38 | 247 | 84.62 15.38 | 100.00 | 37.19 59.38 | 39.46 | 33.39 6.07 | 39.46 -----------+----------------------+---------- High | 353 26 | 379 | 93.14 6.86 | 100.00 | 62.81 40.62 | 60.54 | 56.39 4.15 | 60.54 -----------+----------------------+---------- Total | 562 64 | 626 | 89.78 10.22 | 100.00 | 100.00 100.00 | 100.00 | 89.78 10.22 | 100.00
Love and divorce | Separated or Divorced love | No Yes | Total -----------+----------------------+---------- Low | 236 30 | 266 | 88.72 11.28 | 100.00 | 41.99 46.88 | 42.49 | 37.70 4.79 | 42.49 -----------+----------------------+---------- High | 326 34 | 360 | 90.56 9.44 | 100.00 | 58.01 53.12 | 57.51 | 52.08 5.43 | 57.51 -----------+----------------------+---------- Total | 562 64 | 626 | 89.78 10.22 | 100.00 | 100.00 100.00 | 100.00 | 89.78 10.22 | 100.00
Statistical Inference • Using samples to infer characteristics about populations • What inferences? Primarily means and proportions • Means and proportions indicate central tendencies of important characteristics
Central Limit Theorem • Know the sampling distribution of means from properties of the population • Mean of sampling distribution of means is mean of the population • Standard deviation of sampling distribution of means is times sd of population • Sampling distribution is normal
Sampling Distribution of Means • Take a random sample of size n from a population with any distribution • Calculate the mean of the sample • Record the mean • Repeat infinitely, recording all means and making a distribution of the means • This is a sampling distribution of means
Sampling distribution of means 95% Pop mean Size of Sampling Distribution sd
A Sample Mean = 23.7 Standard Deviation = 3 n = 900 What kind of population could this sample have come from? Population mean = 22? Population mean = 23? Population mean = 24? Population mean = 25?
If population mean is 22 • What is population standard deviation? • We don’t know • Use sample information to answer this • How calculate sample sd?
If pop mean=22, sd=3, n=900 • Central Limit Theorem says • Sampling distribution mean will be 23 • Sampling distribution sd = 3 / 30 = .1 • 95% of all samples will have mean of 22 ± 2 * .1 Thus, the range from 21.8 - 22.2 will contain 95% of sample means.
If pop mean=23, sd=3, n=900 • Central Limit Theorem says • Sampling distribution mean will be 23 • Sampling distribution sd = 3 / 30 = .1 • 95% of all samples will have mean of 23 ± 2 * .1 Thus, the range from 22.8 - 23.2 will contain 95% of sample means.
If pop mean=24, sd=3, n=900 • Central Limit Theorem says • Sampling distribution mean will be 24 • Sampling distribution sd = 3 / 30 = .1 • 95% of all samples will have mean of 24 ± 2 * .1 Thus, the range from 23.8 - 24.2 will contain 95% of sample means.
Look at each of these • Pop mean 22, sd 3 ==> 21.8 - 22.2 • Pop mean 23, sd 3 ==> 22.8 - 23.2 • Pop mean 24, sd 3 ==> 23.8 - 24.2 • Pop mean 25, sd 3 ==> 24.8 - 25.2 • Our sample mean is 23.7 -- an unlikely event from any above hypothesis.
Pop mean=24, sd=3, n=900 Sampling Distribution 95% 23.7 23.8 23.9 24 24.1 24.2 Our Sample
Conventions • An unlikely event is one that occurs less than 1 / 20 that is, has a probability less than .05 • An unlikely event is one that occurs less than 1 /100, or p < .01 • An unlikely event is one that occurs less than 1/1000, or p < .001
Which convention to use? • Answer depends upon risks of being wrong. • What are the consequences of deciding men do not earn more than women? • What are the consequences of deciding a drug has no side effects? • What are the consequences of deciding the “greenhouse” gases have no effect on the earth’s temperature?
Two kinds of risk • Fail to reject a hypothesis that is false • Reject a hypothesis that is true • The only one that we have real control over is the probability of rejecting a hypothesis that is, in fact, true • Let’s look at this one
Pop mean=24, sd=3, n=900 Sampling Distribution 95% 23.7 23.8 23.9 24 24.1 24.2 Our Sample