Download
1 / 3
30 likes | 184 Views
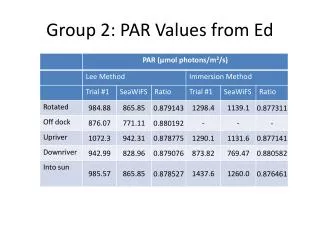
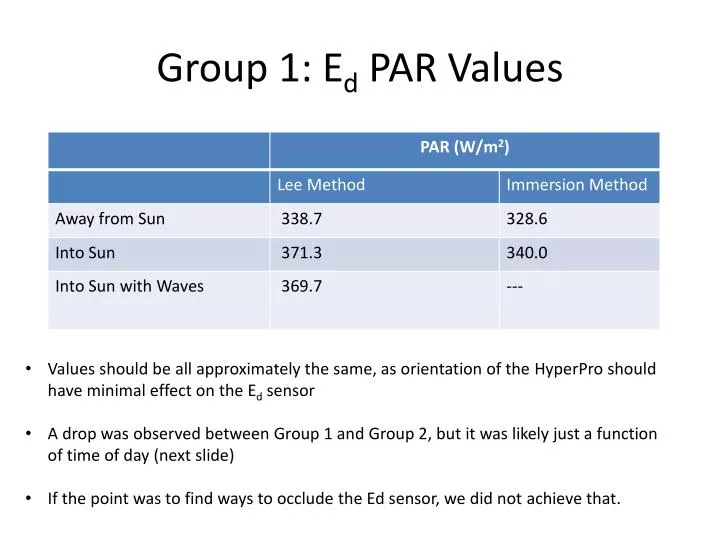
Group 1: E d PAR Values. Values should be all approximately the same, as orientation of the HyperPro should have minimal effect on the E d sensor A drop was observed between Group 1 and Group 2, but it was likely just a function of time of day (next slide)

E N D
Group 1: Ed PAR Values • Values should be all approximately the same, as orientation of the HyperPro should have minimal effect on the Ed sensor • A drop was observed between Group 1 and Group 2, but it was likely just a function of time of day (next slide) • If the point was to find ways to occlude the Ed sensor, we did not achieve that.
Kd from Secchi Disks • From ACS data, a(530nm)=0.54, c(530nm)=2.51 • Poole & Atkins (1929) calculated that zscagrees well with 1.7/Kd • for our case, Z_sc=2.13m, K_d=0.8 • Idso & Gilbert (1974) did a number of experiments using (then) modern equipment which found that Poole & Atkins was surprisingly accurate. • Other relationships have been suggested, but Poole & Atkins appears to have a solid body of evidence in a number of different waters.