Download
1 / 29
350 likes | 631 Views
Mail Network Optimisation Project: Speed Post KPIs & First Class Mail Network. India Post ’ s revenues Percent. Mail Revenue Rough estimates in percent. Mail Network Optimisation project focuses on postal (mail) business, which account above 50% of the department’s revenues. Text.

E N D
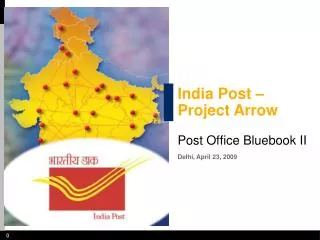
Mail Network Optimisation Project: Speed Post KPIs & First Class Mail Network
India Post’s revenues Percent Mail Revenue Rough estimates in percent Mail Network Optimisation project focuses on postal (mail) business, which account above 50% of the department’s revenues Text 100% = INR 5,862 crore International mail Ordinary and registered mail Speed post Postal receipts SB & Financialservices SOURCE: Postal and saving bank split taken from Demand for grants and the mail revenue split based on the semiannual survey
There are 3 main reasons why improvement inMail Business is required EXAMPLES – NON-EXHAUSTIVE India Post's total mail volume,million items p.a.1 746 India Post is losing volume and market share significantly 654 -12% 2004/05 2008/09 Customer survey results2 Customers rate India Post low, especially in reliability EBIT3 margin of postal operators > 30% > 25% India Post's financial performance is poor compared with that of other players > 20% 4 4 4 1 Based on annual report and book of information 2 Based on 50 extensive and structured interviews with 20 loyal and 30 former Speed Post customers 3 EBIT = Earnings before Interest and Tax 4 Mail division only SOURCE: Mail Network Optimisation Project
Scope of the project "Get the core right" • Optimise India Post’s mailnetwork from collection to delivery • Standardise processes with focus on quality improvement and reduction in complexity • Establishaneffective performance manage-ment structure using KPIs and regular reviews Text SCOPE "Modernise the look and feel" • Improve India Post's appearance to make it more trustworthy and reliable for customers • Broad approach to upgrade processing facilities and improve working conditions for employees • Make staff and customers proud of being associated with India Post SOURCE: Mail Network Optimisation Project
City 3 Mail Office City 1 PO 1 Mail Office 2 PO 2 PO 3 Mail Office 1 TMO City 2 TMO Mail Office PO 3 PO 2 PO 1 Components of the Core Operational Areas 1 What is the right network? What is the right network schedule? 2 3 What are the right processes? How to measure India Post's performance? 4 SOURCE: Mail Network Optimisation Project
Project Roadmap All India 2012 Roll-out Text 2011 Geographical reach Prioritycities "Wave 1" "Wave 2" "Wave 3" 1 Scenario-based design Scenario-based design and pilots Speed Post & International mail First class Second class Product range Approach particularly reflects strong need for immediate tangible impact SOURCE: Mail Network Optimisation Project
1 The KPIs and performance management system follows 3 improvement objectives Track improvements in delivery quality (D+x, main objective of the project) in a fact based manner Ensure sustainability of improvements by tracking not only D+x but also supporting KPIs (e.g. missing PIN codes) and scan compliance What are the objectives of the performance management system? 2 Accelerate continuous improvement by providing on-the-ground teams with the tools to understand root causes of delay 3 SOURCE: Mail Network Optimisation Project
1 3 4 2 D+X reports International reports Supporting KPIs Scan compliance reports 4f 4g 2b 3a 1b 1d 1c 2f 4a 3b 2a 2c 2e 1a 4d 4e 4c 4b 4h 3c 2d A comprehensive set of systematic KPIs have been developed to ensure effective performance monitoring KPI What does it do? Transit analysis within city (TD) • Measures speed and reliability of processing of Speed Post articles from booking to delivery Transit analysis across cities (NTD) Time per leg of transit within city (TD) Time per leg of transit across cities (NTD) Lost Text Share of scans against total expected within city (TD) • Measures for each processing step whether articles got scanned as prescribed Share of scans against total expected across cities (NTD) Share of articles with all scans within city (TD) Share of articles with all scans across cities (NTD) Scan analysis per leg of transit within & across cities (NTD) Delivery scan compliance Percent of F-scans `in SpeedNet vs. F-scans in IPS • Measures for international inbound article the efficiency of movement at every step before merger with Speed Post Percent of F-scans in IPS vs. D-scans in IPS Percent of F-scans in IPS vs. I-scans in IPS/ SpeedNet Articles processed per hour per FTE • Supports achieving better D+x and scan performance Staff absenteeism Share of bags without bag labels Share of articles with missing Pin Codes Outbound operational performance has been discontinued starting 27th Jan Share of mis-sorted articles Flight compliance Share of duplicate bar codes Inbound operational performance SOURCE: Mail Network Optimisation Project
Transit analysis within city (TD) • Measures speed and reliability of processing of Speed Post articles from booking to delivery Transit analysis across cities (NTD) Time per leg of transit within city (TD) Time per leg of transit across cities (NTD) Share of scans against total expected within city (TD) • Measures for each processing step whether articles got scanned as prescribed Share of scans against total expected across cities (NTD) Share of articles with all scans within city (TD) Share of articles with all scans across cities (NTD) Scan analysis per leg of transit within & across cities (NTD) 4 1 3 Scan compliance reports Supporting KPIs International reports D+X reports 2 1b 3a 3b 3c 4a 4b 1a 4h 2e 4c 2a 1c 4d 2c 2b 2d 4e 1d 4f 4g 2f Delivery scan compliance The most relevant KPIs Most relevant KPIs KPI What does it do? Text Lost Percent of F-scans `in SpeedNet vs. F-scans in IPS • Measures for international inbound article the efficiency of movement at every step before merger with Speed Post Percent of F-scans in IPS vs. D-scans in IPS Percent of F-scans in IPS vs. I-scans in IPS/ SpeedNet Articles processed per hour per FTE • Supports achieving better D+x and scan performance Staff absenteeism Share of bags without bag labels Share of articles with missing Pin Codes Share of mis-sorted articles Flight compliance Share of duplicate bar codes Inbound operational performance SOURCE: Mail Network Optimisation Project
Transit analysis within city (TD) • Measures speed and reliability of processing of Speed Post articles from booking to delivery Transit analysis across cities (NTD) Time per leg of transit within city (TD) Time per leg of transit across cities (NTD) Share of scans against total expected within city (TD) • Measures for each processing step whether articles got scanned as prescribed Share of scans against total expected across cities (NTD) Share of articles with all scans within city (TD) Share of articles with all scans across cities (NTD) Scan analysis per leg of transit within & across cities (NTD) Scan compliance reports 3 4 2 D+X reports International reports Supporting KPIs 1 3c 4a 3b 4b 3a 1b 1a 4h 2e 2b 4e 4c 2f 1c 4d 2c 2d 1d 4f 4g 2a Delivery scan compliance D+X Reports KPI What does it do? Text Lost Percent of F-scans `in SpeedNet vs. F-scans in IPS • Measures for international inbound article the efficiency of movement at every step before merger with Speed Post Percent of F-scans in IPS vs. D-scans in IPS Percent of F-scans in IPS vs. I-scans in IPS/ SpeedNet Articles processed per hour per FTE • Supports achieving better D+x and scan performance Staff absenteeism Share of bags without bag labels Share of articles with missing Pin Codes Share of mis-sorted articles Flight compliance Share of duplicate bar codes Inbound operational performance SOURCE: Mail Network Optimisation Project
0 By SPC TD vs. NTD 1 6 2 1 5 4 3 What information does the "D+X KPI" provide? Speed Spread Shows the average time from booking to delivery Shows the delivery time spread and also variability across days Description Article booked on Saturday 26th June delivered on Tuesday 29th June- D+2 days Weighted average computed of articles delivered in the specified period 50% Delivery spread measured 40% 10% D+1 D+2 D+3 Example Bangalore Chennai Hyderabad Kolkata Airport Mumbai New Delhi Delivery variability measured across days Average D+X = 1.60 days June 2010 Leg-by-leg analysis Available breakdowns Attempted vs. successful Different sectors (e.g., Mumbai to Delhi) Including RTS and excluding RTS articles Note: Detailed calculation logic is in the backup SOURCE: Mail Network Optimisation Project
Average number of days taken for within city transfer Input Processing Output • By SPC • For all articles delivered on a given date, identify article booking date where booking and delivery PO in same city2 • Define per article SPC Source • Article booking date and time Articles (SpeedNet) 1.74 1.56 1.25 1.1 … Kolkata Mumbai Chennai Delhi … • Article booking city Articles (SpeedNet) • Article delivery date and time Articles (SpeedNet) Transit time Deliverydate Bookingdate = – 1a • If a Sunday/ national holiday falls between booking and delivery date, reduce transit time by 11 • Define • Article delivery city Articles (SpeedNet) Average transit time within city = Transit time (i) n ∑ n Where ‘n’ is the count of articles selected i = 1 KPI : Transit analysis within city (TD) Separate report for articles booked under PO/ SPC and BNPL • TD includes all articles booked within the catchment area of a sorting hub 1 Note that only national and gazetted holidays are excluded from transit time calculation. 2 Returned to sender articles from different sorting hubs are not treated for within city transit analysis. SOURCE: Mail network optimisation project
Average number of days taken for across city transfer SPC Transit time Deliverydate Bookingdate = – 1b Average transit time to city Transit time (i) = n m n ∑ ∑ wt(i) × Average transit time to city (i) Average transit time across city i = 1 i = 1 = m KPI : Transit analysis across cities (Non-TD) Separate report for articles booked under PO/ SPC and BNPL Input Processing Output Source • By SPC • For all articles delivered on a given date, identify article booking date where booking and delivery cities are different • Define per article • Article booking date and time Articles (SpeedNet) Bangalore Mumbai Chennai Delhi … 2.4 2.5 2.7 2.8 … • Article booking city Articles (SpeedNet) • Article delivery date and time Articles (SpeedNet) • If a Sunday falls between booking and delivery date, reduce transit time by 11 • Define for a given destination city • Article delivery city Articles (SpeedNet) Where n is count of articles considered • Define for a given source city 1 Note that only national and gazetted holidays are excluded from transit time calculation. Where wt(i) is articles booked for city (i) Where m is destination cities considered for the analysis SOURCE: Mail network optimisation project
1 RTS mails are captured as TD if article attempted delivery scan or RTS remark are missing The system cannot identify article shown below as ‘Return to Sender’ but as mis-sort because the scan for attempted delivery at Kagal is missing • This article will show up as a mis-sorted TD article, even though it is a NTD Return-to-Sender article • When the article is being returned, delivery PO has to update the remark on article as RTS SOURCE: Mail network optimisation project
1c Time sub-sequentscan Timepreviousscan Time per leg Processing time across a leg within city = – = n ∑ Time between leg (i) i = 1 n KPI : Processing time across each leg of value chain within city (TD) Input Processing Output Source • Select articles where either Booking PO or SPC receipt scan or SPC dispatch scan is in the selected SPC and Delivery PO is in the same city • Identify time between two scans as time per leg of the transit chain • Define for each article • Select SPC as source and same SPC as destination (transit within a city) • Time scans at each leg of the transit chain for within city transit. This includes following scans • Booking PO • SPC receipt • SPC Bag Open • SPC Bag Close • SPC Dispatch • PO Receipt • Final Delivery SPC Master (SpeedNet) Articles, Bag Contents, Bag Details, Bags Received (SpeedNet) • Define per leg Where n is the number of articles considered SOURCE: Mail Network Optimisation Project
Time sub-sequentscan Timepreviousscan Time per leg = – 1d Processing time across a leg across city = n ∑ Time between leg (i) i = 1 n KPI : Processing time across each leg of value chain across cities (NTD) Input Processing Output Source • Select articles where either Booking PO or Outbound SPC receipt scan or Outbound SPC dispatch scan is in the selected source SPC and Delivery PO, or Inbound SPC receipt scan or Inbound SPC dispatch scan is in destination city • Define for each article • Select SPC as a source and a different SPC as a destination • Time scans at each leg of the transit chain for source destination SPC. This includes following scans • Booking PO • Outbound SPC receipt, Bag open, Bag close, Dispatch • Inbound SPC receipt, Bag open, Bag close, Dispatch • Delivery PO receipt & Final Delivery SPC Master (SpeedNet) Articles, Bag Contents, Bag Details, Bags Received (SpeedNet) • Define per leg Where n is the number of articles considered SOURCE: Mail network optimisation project
Transit analysis within city • Measures speed and reliability of processing of Speed Post articles from booking to delivery Transit analysis across cities (NTD) Time per leg of transit within city Time per leg of transit across cities (NTD) Share of scans against total expected within city • Measures for each processing step whether articles got scanned as prescribed Share of scans against total expected across cities (NTD) Share of articles with all scans within city Share of articles with all scans across cities (NTD) Scan analysis per leg of transit within & across cities (NTD) Scan compliance reports 3 4 2 D+X reports International reports Supporting KPIs 1 3c 4a 3b 4b 3a 1b 1a 4h 2e 2b 4e 4c 2f 1c 4d 2c 2d 1d 4f 4g 2a Delivery scan compliance Scan Compliance Reports KPI What does it do? Text Lost Percent of F-scans `in SpeedNet vs. F-scans in IPS • Measures for international inbound article the efficiency of movement at every step before merger with Speed Post Percent of F-scans in IPS vs. D-scans in IPS Percent of F-scans in IPS vs. I-scans in IPS/ SpeedNet Articles processed per hour per FTE • Supports achieving better D+x and scan performance Staff absenteeism Share of bags without bag labels Share of articles with missing Pin Codes Share of mis-sorted articles Flight compliance Share of duplicate bar codes Outbound operational performance SOURCE: Mail Network Optimisation Project
Booking post office SPC Delivery post office Booking scan Dispatch scan Receipt scan Dispatch scan Receipt scan Delivery scan 2 1 3 2 4 What information does the "scan compliance KPI" provide? Share of scan compliance Articles with full scan history • KPI identifies actual number of scans available against prescribed scans • KPI identifies number of articles with full scan Description Illustrative TD example KPI: Full scans (%) Article 1 2 3 4 5 Example KPI: Share of scans (%) 100 60 40 100 20 80 20 Per SPC By sector (e.g., Mumbai to Delhi) Available breakdowns Note: Detailed calculation logic is in the backup TD vs. NTD Leg-by-leg analysis SOURCE: Mail Network Optimisation Project
Source 2a KPI : Share of scans against total expected within city (TD) Articles booked under PO/ SPC Input Processing Output • For selected SPC • Select articles where either Booking PO or SPC receipt scan or SPC dispatch scan is in the selected SPC and Delivery PO is in the same city • Identify total expected number of scans from Booking PO to Delivery PO • 8 x number of articles selected • Identify actual number of scans available from Booking PO to Delivery PO for the selected articles • Select SPC as source and same SPC as destination (transit within a city) • Time scans at the following leg of the transit chain for within city transit. This includes following scans • Booking PO Booking scan • Booking PO dispatch scan • SPC receipt • SPC bag open • SPC bag close • SPC dispatch • Delivery PO receipt • Final Delivery SPC Master (SpeedNet) Articles, Bag Contents, Bag Details, Bags Received (SpeedNet) Share of scans against total expected within city Actual number of scans for selected articles = 8 x number of selected articles SOURCE: Mail network optimisation project
Source 2a KPI : Share of scans against total expected within city (TD) Articles booked under BNPL Input Processing Output • For selected SPC • Select articles where either Booking PO or SPC receipt scan or SPC dispatch scan is in the selected SPC and Delivery PO is in the same city • Identify total expected number of scans from Booking PO to Delivery PO • 5 x number of articles selected • Identify actual number of scans available from Booking PO to Delivery PO for the selected articles • Select SPC as source and same SPC as destination (transit within a city) • Time scans at the following leg of the transit chain for within city transit. This includes following scans • Booking office booking scan • Booking office dispatch scan • Mail agency dispatch scan • Delivery PO receipt • Final Delivery SPC Master (SpeedNet) Articles, Bag Contents, Bag Details, Bags Received (SpeedNet) Share of scans against total expected within city Actual number of scans for selected articles = 5 x number of selected articles SOURCE: Mail network optimisation project
Source 2b KPI : Share of scans against total expected across cities (NTD) Articles booked under PO/ SPC Input Processing Output • For selected SPC • Select articles where either Booking PO or Outbound SPC receipt scan or Outbound SPC dispatch scan is in the selected source SPC and Delivery PO, or Inbound SPC receipt scan or Inbound SPC dispatch scan is in destination city • Identify all expected number of scans from Booking PO to Delivery PO • 12 x number of articles selected • Identify actual number of scans available from Booking PO to Delivery PO for the selected articles • Select SPC as a source and a different SPC as a destination • Time scans at the following leg of the transit chain for across city transit. This includes following scans • Booking PO booking, dispatch scans • Outbound SPC receipt, bag open, bag close, dispatch scans • Inbound SPC receipt, bag open, bag close, dispatch scans • Delivery PO receipt, final delivery scans SPC Master (SpeedNet) Articles, Bag Contents, Bag Details, Bags Received (SpeedNet) Share of scans against total expected across city Actual number of scans for selected articles = 12 x number of selected articles SOURCE: Mail network optimisation project
Source 2b KPI : Share of scans against total expected across cities (NTD) Articles booked under BNPL Input Processing Output • For selected SPC • Select articles where either Booking PO or Outbound SPC receipt scan or Outbound SPC dispatch scan is in the selected source SPC and Delivery PO, or Inbound SPC receipt scan or Inbound SPC dispatch scan is in destination city • Identify all expected number of scans from Booking PO to Delivery PO • 9 x number of articles selected • Identify actual number of scans available from Booking PO to Delivery PO for the selected articles • Select SPC as a source and a different SPC as a destination • Time scans at the following leg of the transit chain for across city transit. This includes following scans • Booking office booking, dispatch scan • Mail agency dispatch scan • Inbound SPC receipt, bag open, bag close, dispatch scans • Delivery PO receipt, Final delivery scans SPC Master (SpeedNet) Articles, Bag Contents, Bag Details, Bags Received (SpeedNet) Share of scans against total expected across city Actual number of scans for selected articles = 9 x number of selected articles SOURCE: Mail network optimisation project
Source 2c KPI : Share of articles with full scans within city (TD) Articles booked under PO/ SPC Input Processing Output • For selected SPC • Select articles where either Booking PO or SPC receipt scan or SPC dispatch scan is in the selected SPC and Delivery PO is in the same city • Identify from selected articles count of articles where all the four scans are available • Select SPC as source and same SPC as destination (transit within a city) • Time scans at the following leg of the transit chain for within city transit. This includes following scans • Booking office booking, dispatch scan • SPC receipt, bag open, bag close, dispatch scans • Delivery PO receipt, Final delivery scans SPC Master (SpeedNet) Articles, Bag Contents, Bag Details, Bags Received (SpeedNet) Count of articles where all eight scans are available Share of articles with full scans within city = Count of articles selected SOURCE: Mail network optimisation project
Source 2c KPI : Share of articles with full scans within city (TD) Articles booked under BNPL Input Processing Output • For selected SPC • Select articles where either Booking PO or SPC receipt scan or SPC dispatch scan is in the selected SPC and Delivery PO is in the same city • Identify from selected articles count of articles where all the four scans are available • Select SPC as source and same SPC as destination (transit within a city) • Time scans at the following leg of the transit chain for within city transit. This includes following scans • Booking office booking, dispatch scan • SPC receipt, bag open, bag close, dispatch scans • Delivery PO receipt, Final delivery scans SPC Master (SpeedNet) Articles, Bag Contents, Bag Details, Bags Received (SpeedNet) Count of articles where all five scans are available Share of articles with full scans within city = Count of articles selected SOURCE: Mail network optimisation project
Source 2d KPI : Share of articles with full scans across cities (NTD) Articles booked under PO/ SPC Input Processing Output • For selected SPC • Select articles where either Booking PO or Outbound SPC receipt scan or Outbound SPC dispatch scan is in the selected source SPC and Delivery PO, or Inbound SPC receipt scan or Inbound SPC dispatch scan is in destination city • Identify count of articles from selected articles where all the six scans are available • Select SPC as a source and a different SPC as a destination • Time scans at the following leg of the transit chain for across city transit. This includes following scans • Booking PO booking, dispatch scans • Outbound SPC receipt, bag open, bag close, dispatch scans • Inbound SPC receipt, bag open, bag close, dispatch scans • Delivery PO receipt, final delivery scans SPC Master (SpeedNet) Articles, Bag Contents, Bag Details, Bags Received (SpeedNet) Count of articles where all twelve scans are available Share of articles with full scans across city = Count of articles selected SOURCE: Mail network optimisation project
Source 2e KPI : Scan analysis per leg of transit within city (TD) Articles booked under PO/ SPC Input Processing Output • For selected SPC • Select articles where either Booking PO or SPC receipt scan or SPC dispatch scan is in the selected SPC and Delivery PO is in the same city • Identify articles with scan for each of the four legs • For a given leg (i), where i is 1-4, calculate • Select SPC as source and same SPC as destination (transit within a city) • Time scans at the following leg of the transit chain for within city transit. This includes following scans • Booking office booking, dispatch scan • SPC receipt, bag open, bag close, dispatch scans • Delivery PO receipt, Final delivery scans SPC Master (SpeedNet) Articles, Bag Contents, Bag Details, Bags Received (SpeedNet) Count of articles with scan for leg (i) Scan analysis for leg (i) = Count of articles selected Where i is one of four legs relevant for within city transit SOURCE: Mail network optimisation project
Source 2e KPI : Scan analysis per leg of transit across cities (NTD) Articles booked under BNPL Input Processing Output • For selected SPC • Select articles where either Booking PO or Outbound SPC receipt scan or Outbound SPC dispatch scan is in the selected source SPC and Delivery PO, or Inbound SPC receipt scan or Inbound SPC dispatch scan is in destination city • Identify articles with scan for each of the six legs • For a given leg (i), where i is 1-6, calculate • Select SPC as a source and a different SPC as a destination • Time scans at the following leg of the transit chain for across city transit. This includes following scans • Booking office booking, dispatch scan • Mail agency dispatch scan • Inbound SPC receipt, bag open, bag close, dispatch scans • Delivery PO receipt, Final delivery scans SPC Master (SpeedNet) Articles, Bag Contents, Bag Details, Bags Received (SpeedNet) Count of articles with scan for leg (i) Scan analysis for leg (i) = Count of articles selected Where i is one of six legs relevant for across city transit SOURCE: Mail network optimisation project
Source 2f KPI : Delivery Scan Compliance Share of TD articles having delivery scans after 5 days of booking Input Processing Output • By SPC • For all articles booked 5 working days earlier to any specific day, in the catchment area of the sorting hub. • Identify articles with delivery scans within 5 working days after booking. • Share of articles without delivery scan after 5 days of booking: Share of articles without delivery scans after 5 days of booking • Article booking date and time Articles (SpeedNet) % TD without delivery scan Booking Sorting Hub Total TD Articles Booked Agra 1000 33.41% • Article booking city Articles (SpeedNet) Ahmedabad 1200 34.34% • Article delivery date and time Articles (SpeedNet) Ajmer 300 34.81% Count of articles with delivery scan Allahabad 1300 31.82% • Article delivery city Articles (SpeedNet) = 1 – Bangalore 3000 17.39% Count of articles booked Chennai 2970 20.47% SOURCE: Mail network optimisation project