Download
1 / 22
220 likes | 300 Views
Krishna Thakur Hu Suk Lee . Spatial Risk Factors for West Nile Virus Positivity in Mosquitoes in Indiana State. Outline. Introduction GIS questions? Objectives Materials and Methods Results Discussion Conclusions. What is WNV?.

E N D
Krishna Thakur HuSuk Lee Spatial Risk Factors for West Nile Virus Positivity in Mosquitoes in Indiana State
Outline • Introduction • GIS questions? • Objectives • Materials and Methods • Results • Discussion • Conclusions
What is WNV? • West Nile virus (WNV) is a Flavivirus which causes neurological disease in humans, horses and other animals • Birds develop substantial viremia and are considered a major reservoir host • Humans and horses are dead-end hosts • WNV was first detected in 1999 in the United States (New York State)
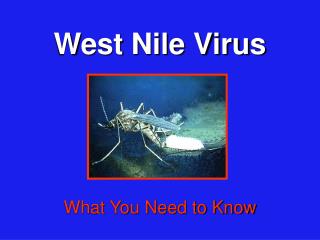
Transmission by Mosquitoes • WNV is an Arbovirustransmitted by several mosquito species • Most important vector: Culex spp. • Mosquito abundance is associated with environmental and anthropogenic factors • Standing Water • Vegetation overgrowth • Urbanization • Host population (Humans and Horses)
GIS question? • Why some of the counties in Indiana State have high positive cases of mosquitoes for WNV compared with other counties?
Objectives • Use GIS to compare counties in Indiana in terms of high and low positive cases of WNV to • Human population density • Horse population density • Percent of wetland • Percent of urban • Percent of different types of land uses • Identify areas with high risk and make a risk map for WNV in Indiana using Ordinary least square regression model(OLS)
Materials • Data sources • WNV mosquito cases by county in Indiana State in 2010 http://diseasemaps.usgs.gov/wnv_in_mosquito.html • Indiana State map by county from Statewide danpatch.ecn.purdue.edu\asm540\data\tippecanoe\statewide • Wetland Data http://inmap.indiana.edu/dload_page/hydrology.html • Land cover danpatch.ecn.purdue.edu\asm540\data\tippecanoe\landcover
Materials • Data sources • Human population (Census block) http://inmap.indiana.edu/dload_page/demographics.html • Horse population http://www.ces.purdue.edu/extmedia/ID/ID-320-W.pdf • Census urban Area danpatch.ecn.purdue.edu\asm540\data\tippecanoe\statewide • Other related references
Methods • Normalization by area of county • Human population • Horse population • Area of wetland • Area of land use type • Recombination and reclassification • Forest= Deciduous + Evergreen + Mixed • Wetland= Herbaceous + Woody
Methods FINAL MODEL
Methods • Normalization by area of county • Human population • Horse population • Wetland area • Land cover values • Reclassification and recombination of Land cover values • Forest= Deciduous + Evergreen + Mixed • Wetland= Woody wetland+ Emergent herbaceous wetland
Discussion • WNV cases in mosquitoes are related with • Human density • This model explains 28% of variation in WNV cases in mosquito indicating some variables are still missing in the model • Predicted cases are not spatially autocorrelated indicating random pattern and model significance
Discussion • GIS • OLS tool and Spatial correlation tool work well in comparing and modeling multiple spatial factors • Good Visualization tool to understand the distribution of disease and associated risk factors • Useful to obtain spatial data for other studies
Conclusion • Required more factors in order to explain the WNV cases in mosquito • Obtained data can be analyzed using robust statistical software • Helpful to design mosquito control program • Acquaintance with GIS application in spatial epidemiology