Download
1 / 15
150 likes | 292 Views
China’s Future Oil Demand for Road Transportation. Co-authors: Ronald Soligo Professor of Economics Rice University Kenneth B. Medlock III James A. Baker, III, and Susan G. Baker Fellow in Energy and Resource Economics Rice University . James Coan Research Associate Energy Forum

E N D
China’s Future Oil Demand for Road Transportation Co-authors: Ronald Soligo Professor of Economics Rice University Kenneth B. Medlock III James A. Baker, III, and Susan G. Baker Fellow in Energy and Resource Economics Rice University James Coan Research Associate Energy Forum Baker Institute for Public Policy Rice University October 11, 2011
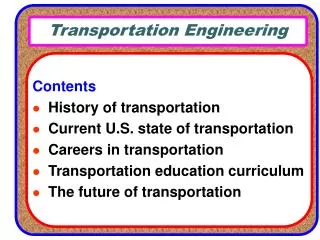
Overview of Presentation • Projection of How Much an Average Light-duty Vehicle Will be Driven in China • Projection of Road Freight (usually Medium/Heavy Truck) Oil Use in China • Next steps Toward Projecting Total Road Transportation Oil Use
Light Duty Vehicles: Vehicle Use Often Matters More than Light-Duty Vehicle Stocks Light-Duty Vehicle Stocks Per Capita Light-Duty Vehicle Use Per Capita 200% 50% • Vehicle stocks only account for 1/3 of the difference in vehicle use between U.S. and Japan. Source: Millard-Ball, Adam and Lee Schipper. 2010. “Are We Reaching Peak Travel? Trends in Passenger Transport in Eight Industrialized Countries.” http://www.geog.mcgill.ca/faculty/millard-ball/Millard-Ball_Schipper_Peak_Travel_preprint.pdf.
Light Duty Vehicles: Vehicle Use Very Different in Japan, Western Europe and North America Light-Duty Vehicle Stocks Per Capita Light-Duty Vehicle Use Per Capita Canada Canada, Western Europe, Japan Western Europe ~100% Japan • Canada, Western Europe, and Japan have roughly the same number of light-duty vehicles/capita, but each vehicle is driven about twice as much in Canada and 50-75% more in Europe than in Japan. Source: Millard-Ball, Adam and Lee Schipper. 2010. “Are We Reaching Peak Travel? Trends in Passenger Transport in Eight Industrialized Countries.” http://www.geog.mcgill.ca/faculty/millard-ball/Millard-Ball_Schipper_Peak_Travel_preprint.pdf.
By Comparing Density, China Seems More Like Western Europe or Japan than North America China in 2020: Density of between 4,770-5,850 people per km2 China in 2035: Density of between 3,420-4,870 people per km2 This analysis takes into account findings from Angel et al. (2011) that doubling GDP/capita leads to a density decline of 25-40%, while a doubling of the population size of a city increases density by 16-19%. Sources: Demographia. 2011. “Demographica World Urban Areas (World Agglomeations).” 7th Annual Edition. April. http://www.demographia.com/db-worldua.pdf. Angel, Shlomo et al. 2011. “Making Room for a Planet of Cities.” Lincoln Institute of Land Policy. https://www.lincolninst.edu/pubs/dl/1880_1195_Angel%20PFR%20final.pdf.
Comparing Rail Modal Share China Appears to be • Headed on a Path More Like Western Europe than Japan Sources: UK Department of Transport, Energy Data Modelling Center (Japan), China Statistical Yearbook, Penn World Tables
If Extensive Rail Investment Continues/Accelerates, China May be More Like Japan Source: International Transport Forum. http://www.internationaltransportforum.org/statistics/index.html.
Projecting How Much an Average Light-Duty Vehicle Will be Driven in China 2020 2035 At $15,000 GDP/capita, each vehicle was driven about 25-30 percent more in the UK than Japan, and this increased to 50-60 percent at $26,500/capita. Sources :UK Department of Transport, Energy Data Modelling Center (Japan) Note: This assumes GDP/capita of in 2005$ PPP, using Penn World Tables as baseline and growth projections from IEA
Moving Freight in China Could be a Significant Consumer of Oil Source: Schipper, L., Scholl, L., Price, L.,1997 ENERGY USE AND CARBON EMISSIONS FROM FREIGHT IN 10 INDUSTRIALIZED COUNTRIES: AN ANALYSIS OF TRENDS FROM 1973 TO 1992; Kamakaté and Schipper 2009.
Relationship Between Freight Ton-Kms and Oil Use Sources: L. Schipper, L. Scholl, and L. Price, “Energy Use and Carbon Emissions From Freight in 10 Industrialized Countries: An Analysis of Trends from 1973 TO 1992,” Transportation Research Part D: Transport and Environment 2, no. 1 (1997): 57-76. F. Kamakaté and L. Schipper, “Trends in Truck Freight Energy Use and Carbon Emissions in Selected OECD Countries from 1973 to 2005,” Energy Policy 37 (2009): 3743-51.
China Is Very Intensive in Terms of Freight Ton-Kms per Unit GDP, and Intensity May Increase Further Freight Ton-Kmsper Dollar of GDP in Eastern European Countries High but Still Lower than China China’s ton-kms per unit GDP is higher than any other country we’ve found, twice as high as the U.S. and four times higher than Western Europe. Given the relationship between ton-kms and oil use, China should be using about 340,000 b/d per trillion GDP, twice the average . Yet China’s oil use seems fairly average at this point close to 170,000 b/d. China2008 China 2009 Sources: Eurostat, China Statistical Yearbook
Factors Influencing Future Chinese Trucking Freight Ton-Kms • Factors That May Increase Freight Oil Use in the Future: • Current overloading of trucks may be controlled • Initiatives to move production toward western China • No clear push to regulate fuel efficiency in medium/heavy trucks • Factors That May Restrict Freight Oil Use in the Future: • Chinese government has a very significant commitment to rail (120,000 kms by 2015, up from about 86,000 kms in 2009) • Possibly better logistics and reduced “empty miles”
Conclusions • Both how light-duty vehicles are driven and oil use from trucking freight deserve our respect – they are sometimes overlooked compared with awe at the hundreds of millions of light-duty vehicles that will be on China’s roads, but they are very important for oil use. • There is a large range of how light-duty vehicles are driven around the world; Chinese vehicles will likely be driven similar to vehicles in Japan/Western Europe. • China has a very high level of freight ton-kms for its level of GDP, and even if use is average, oil use will still be 3.6 million b/d in 2020 and 6.4 million b/d in 2035.
Next Steps • In order to fully project oil use from road transportation, we will • Estimate future vehicle stocks for China (using International Road Federation data with >100 countries) • Conduct interviews on the future of freight in China If you would like a copy of the presentation or have questions: jcoan@rice.edu
Light Duty Vehicles: Vehicle Use Per Vehicle Different in Japan, Western Europe, and U.S./Canada U.S., Canada Major Western European Countries Japan Source: International Energy Agency, Transport, Energy and CO2: Moving Toward Sustainability (Paris: International Energy Agency, 2009).