Download
1 / 10
100 likes | 163 Views
zVertex Study. Cuts were integrated into the analysis such that there were 6 different sets analyzed: Minbias (with nuclear excitation) zVertex > 0 and 0.1 < y < 0.5 zVertex > 0 and 0.5 < y < 1.0 zVertex < 0 and 0.1 < y < 0.5 zVertex < 0 and 0.1 < y < 0.5

E N D
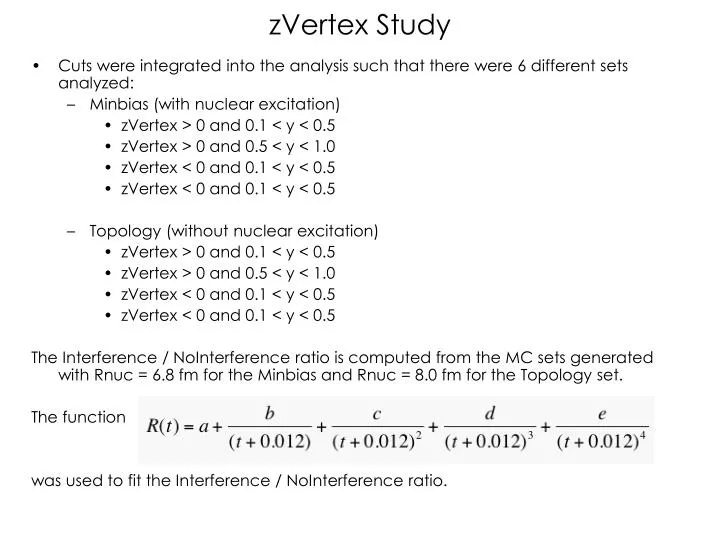
zVertex Study • Cuts were integrated into the analysis such that there were 6 different sets analyzed: • Minbias (with nuclear excitation) • zVertex > 0 and 0.1 < y < 0.5 • zVertex > 0 and 0.5 < y < 1.0 • zVertex < 0 and 0.1 < y < 0.5 • zVertex < 0 and 0.1 < y < 0.5 • Topology (without nuclear excitation) • zVertex > 0 and 0.1 < y < 0.5 • zVertex > 0 and 0.5 < y < 1.0 • zVertex < 0 and 0.1 < y < 0.5 • zVertex < 0 and 0.1 < y < 0.5 The Interference / NoInterference ratio is computed from the MC sets generated with Rnuc = 6.8 fm for the Minbias and Rnuc = 8.0 fm for the Topology set. The function was used to fit the Interference / NoInterference ratio.
minbias • zVertex > 0 • 0.1 < y < 0.5
minbias • zVertex > 0 • 0.5 < y < 1.0
minbias • zVertex < 0 • 0.1 < y < 0.5
minbias • zVertex < 0 • 0.5 < y < 1.0
topology • zVertex > 0 • 0.1 < y < 0.5
topology • zVertex > 0 • 0.5 < y < 1.0
topology • zVertex < 0 • 0.1 < y < 0.5
topology • zVertex < 0 • 0.5 < y < 1.0