Download
1 / 53
530 likes | 541 Views
85-131 COMPUTER-AIDED DESIGN. ENGINEERING BY DESIGN LECTURE #12&13 By Dr. Daniela Pusca). DESIGN PHASE 3: Abstraction and Synthesis. CONCEPTUAL DESIGN. During this design phase: Develop ……………… and generate ……………………….. for the problem Recall problems previously solved

E N D
85-131 COMPUTER-AIDED DESIGN ENGINEERING BY DESIGN LECTURE #12&13 By Dr. Daniela Pusca)
DESIGN PHASE 3:Abstraction and Synthesis CONCEPTUAL DESIGN
During this design phase: • Develop ……………… and generate ……………………….. for the problem • Recall problems previously solved • Develop solutions that are acceptable to all involved • Reconsider the problem statement
Synthesis What is conceptual design? Is concerned with SYNTHESIS defined in the Concise Oxford Dictionaryas: “combination, composition, putting together, building up of separate elements into a connected whole.”
General Methodology(An Iterative Design Process= Loop Method) • Generate …………………… 2. Generate ……………………………………………… 3. ………………………., pruning out the worst ones (and maybe adding some new ones) 4. ……………….... and iterate until there is only one solution concept left
Goal Evaluate the design solutions to derive alternative design solutions that all satisfy the PDS, and ………………………….. with respect to the PDS.
The Main Iterative Loop Several solution Concepts Evaluate Lead concepts Iteration 1 Reasoning Iteration 2 Expanded Concepts Evaluate Lead concepts Reasoning
Cont’d The Main Iterative Loop • In the first iteration come up with 6 concepts (at least 1 concept each student in the team). 2. Through evaluation you would choose the best 3 concepts. 3. Expand the list through the reasoning stage of the iteration to get a total of maybe 4 concepts. 4. Then iterate over the process to come up with 2 concepts, which through reasoning you'd expand to 3. 5. Iterate once more to get a single design concept that will be the concept you develop further. This kind of design is sometimes called …………………………, because it tends to move towards …………………………
Generating Concepts Concepts are general ideas for solutions ……………………………... Concepts Are best generated by individuals Their selection is best performed in groups
Techniques Used to Develop and Evaluate Concepts (Chapters 6 and 7) Modeling Design by Accident Creativity Stimulation Techniques . Morphological Charts
Communicating Concepts Useful tool: ……………………. Distinguish one concept from another using a naming system for each concept (A, B,… Indicate key points using ………………………. on the sketch: Remind you ………. you liked the concept Clarify …………. you were thinking (for others, who will study your concept)
Generating Evaluation Criteria The criteria are ………………….. of FRs and constraints (Cs) in the PDS, ………………………………………………… Different ………… are in use in industry to rate concepts: - linear scales are used in automotive industry
Linear Scale RATING MEANING much worse, more expensive, more difficult to develop, more complex, harder than the datum worse, more expensive, more difficult to develop, more complex, harder than the datum doesn't matter; has no effect; irrelevant; better, cheaper, easier to develop, simpler much better, cheaper, easier to develop, simpler than the datum
Cont’d Observations: • Criteria are …………… to which concepts are compared. 2. Concepts are ……….. compared to each other. 3. The same scale will be used to evaluate …. ……………………………………………………..
Example: The requirement is that the product must be cheap. A corresponding criterion might be: The product must cost between $80 and $100. Next step: Rateeach conceptwith respect to the criterion! Do not rate………………………………………… ……………………………………
Evaluating Concepts Evaluating a concept = comparing it to a set of criteria to determine if the concept is acceptable in general terms. In optimization a detailed design is altered ……….. ………………………….. of the design in order to: • maximize performance • maximize quality • minimize cost ……………………………………… ………………………..
Guidelines for Evaluating Concepts 1. Discuss all concepts in a group without making any ……………., …………….., or ……………………about the concepts. 2.Assess the viability of a concept (its ……………….. and …………………..) without deciding that one concept is acceptable or better than other concepts.
Cont’d 3. All evaluation criteria must be based …………………………….. 4. If you can't justify a criterion with respect to something in the PDS, then don't use the criterion. 5. ……………….. of criteria and ………………. of concepts must occur within the …………, not individually.
Decision Matrix Decision Matrix is a tool used to “……….” the concepts and to compare the results.
Preference Scale for Decision Matrix Rating (%) Description 100 complete satisfaction; objective satisfied in every respect 90 extensive satisfaction; objective satisfied in all important aspects 75 considerable satisfaction; objective satisfied in most aspects 50 moderate satisfaction; a middle point between complete and no satisfaction 25 minor satisfaction; objective satisfied in some but less than half of all aspects 10 minimal satisfaction; objective satisfied to a very small extent 0 no satisfaction; objective not satisfied in any aspect
Cont’d In this representation of the DM: Each row the DM represents one FR. Each column represents a design concept. The ………………… is a number meant to indicate how important a particular issue is with respect to other issues. Based on empirical studies The sum of all weighting factors ………………..
Cont’d Each concept carries two values ………………………… ( measure of how well a concept meets a given FR) ………………………. (of the percentage value and the corresponding weighting factor for that FR) Ex: 0.80x0.023=0.018 (for overtime, concept A)
Cont’d The ”overall evaluation” Is the sum of all the non-percentage values for a given concept Is represented in the last row or in the last column, depending on the format chosen for the DM
Other Format for DM • Ex: (for downtime, concept A) ………………….., or ………………………
Methodology 1. On the evaluation table, mark the bad concepts as ………… and good concepts as …………….. ………………. rows representing bad concepts from the evaluation matrix just mark them ``bad.'' You may need to come back to the ``bad'' concepts later. 2. Using some rules (given below), create some new concepts that are basically …………… of existing concepts. Give each new concept a name and a column (row) in the evaluation matrix. The number of concepts you add …………………. than the number of concepts you marked as ``bad.''
Cont’d 3. Reevaluate all the new concepts and calculate ………………………………. for them. 4. Iterate back to step 1, above, and continue until there's only one ``good'' concept left.
Rules ·Look at the …………. aspects of the ...................... What would have to be done to the concept to improve it with respect to that badly scored criterion? If something can be done, how does that impact other positive aspects of the concept? · Look at the ………………………. Is there something ………….. about them that could be used to bolster the positive concepts? Is there something easily done that can turn a bad concept into a good one?
Abstraction • Modeling is part of the abstraction process. • Engineers use models …………………………. their ideas. • Why MODELS? Organize data Allow to Structure thoughts Describe relationship Analyze proposed design
Models As Purposeful Representation Model = any representation of a process, object, or system that captures at least some of its perceived structure or behavior. Models are ……………………, due to simplifying assumptions that were maid in developing them.
Cont’d Models As Purposeful Representation Example: A model for a machinery • Blueprints • Computer –based 3D solid modeling • Graphical output of a structural analysis • Mathematical equations describing the machinery’s function • A kinematic simulation • A wooden mock-up • A bill of materials
Cont’d Models As Purposeful Representation Complete Precise Robust ………………………… (characteristics) Of a verifiable nature Of high quality
Cont’d Models As Purposeful Representation Remember: For each way of thinking there is a ……………….. best way of model building Bad model Bad product Severe consequences to the user of the product
Model Formats Model Formats ……………. …………… Computer-based representations (simulation, CAD, FE) Mathematical representations Graphical representations Physical models
Cont’d Abstract Models • Should describe a concept in sufficient detail to allow: • its evaluation • its refinement • May be used as a basis for a ………... representation for the design ( a clay mock-up, or a prototype) • May be used as a basis for …………….. the design without generation of a concrete model ( a CAD description for example).
Cont’d Concrete Models • Are valuable: save us money, time and effort • Materials used: clay, cardboard, wood, rubber • Allow to discover: - unexpected behavior or - unanticipated difficulties
Model Types Model Types …………… Models ……………. Models ……………… Models
1. Iconic Models Examples: - 2D or 3D representations (maps, world globs) - 3D physical models (of proposed buildings, highways,…) - 3D models generated using CAD These models ……………… the system or process under consideration
2. Symbolic Models (Mathematical Models) Example: Equations Area of a circle=¶ r2 F = M·a • Present a …………………………….. • Include the most important aspects of the process or system in symbolic form
3. Analogic Models Examples of analogic models: • Miniature airplanes dynamically tested in wind tunnels • Simulation of manufacturing processes • These models …………………………….. the system or process under consideration. • Are designed to behave in the same way as the real system or process.
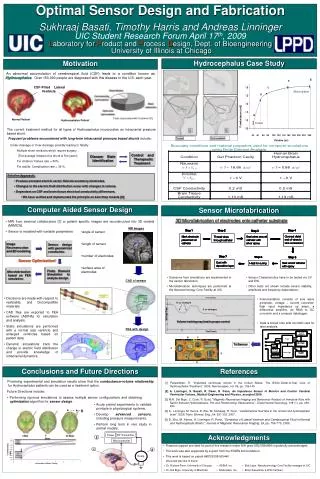
Finite Element, Process Simulation, and Solid Models a). Finite Element Method (FEM) Used to describe: • Fluid flow • Heat transfer • Dynamic mechanical responses • Internal behavior (difficult or impossible to be analyzed in any other way)
Cont’dFEM • The structure is decomposed into discrete elements. • More elements provide a more precise description of the system. • Each region is represented by a set of equations that describe relationships and constraints among the system variables. • A computer model is developed and tested
b). Process Simulation How commercial simulation software work: Insert through the use of software menu options the important ………. and …………….. components: Workstations sites Process parameters Operations Material handling system parameters
Cont’d Process Simulation Modern computer process simulations’ characteristics Visual Intuitive Dynamical display for the system behavior Alphanumerical information Describing the system behavior
Cont’d Process Simulation Case Study: ……………… various operating strategies in the core room and …………. the operating levels and conditions in order to meet the desired hourly requirements. Available information: - Core machine parameters - Robots parameters - Conveyor parameters
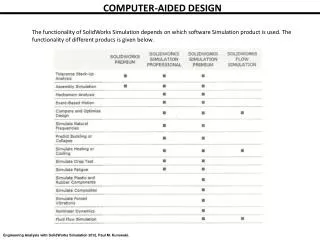
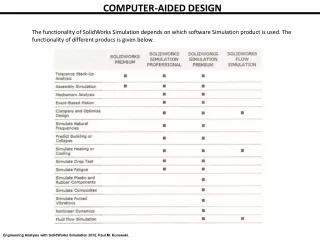
c). Solid Models Solid modeling software CAD Allows the engineer to create ………… ……………………….. Allows the engineer to perform ……………….
System Models Deterministic Stochastic • Perform according to an expected pattern • …………. the expected answer • ……………… the behavior of a system or process • Based on empirical data
Process Models ……………….. ………………. • Describe the actual procedure to be followed • Give general guidelines and rules about how a process should be performed Allow to improve the prescriptive model