Download
1 / 23
230 likes | 232 Views
This workshop highlights the sources of comments and discussions, including safe annex and PICES report, background papers, presentations, and discussions between papers. The comments are structured into overall messages, comments on major reports, what is missing, what is present but vague, and what needs further discussion. The workshop also presents useful ways forward for the participants.

E N D
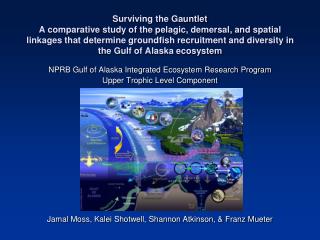
PICES/NPRB Indicators Workshop Points from Background Papers and June 1 Deliberations
SOURCES OF COMMENTS • SAFE ANNEX AND PICES REPORT • ALL THE BACKGROUND PAPERS** • PRESENTATIONS • DISCUSSION BETWEEN PAPERS** • CONTEXT OF EXPERIENCE SEVERAL PLACES (ICES, EU, CANADA, FAO etc)
STRUCTURE OF COMMENTS • OVERALL MESSAGES • COMMENTS ON MAJOR REPORTS • FROM PAPERS AND TALKS • What is missing • What is present but vague • Present but needs further discussion (Gradient across topics) MY OWN IDEAS OF USEFUL WAYS AHEAD
MESSAGE 1 • YOU ARE IN PRETTY GOOD SHAPE!!! • A LOT OF WORK ON OBJECTIVES • APPRECIATION OF NEED FOR SPECIFICITY • OBJECTIVES FROM MANY SOURCES ARE CONVERGING • SOME SOCIAL-ECONOMIC OBJECTIVES • INDICATORS BEING MATCHED TO OBJECTIVES • Acknowledge two modes of use • NOT IN DESPERATION MODE
The Major Reports • Both very good • Different audiences match different content • Both have enough detail to allow user preconceptions to guide selection of content • Do not try to put all the detail that any user will want. Aim for a Guidebook not an Encyclopaedia. (motivate and guide) • Make YOUR big messages clearer.
Papers & Talks – “Missing” • DPSIR structure – proving useful in • Organizing dialogue and reduction in number • Matching Indicators to use in the overall processes • Risk management framework • Overall absence of risk language in papers • Beth’s talk has one good way forward • Need more focus on displaying uncertainty
“Missing” or Under-represented • Of the suites of indicators: • Spatial content (missing everywhere) • Size-based – under-represented relative to their performance elsewhere (esp. ICES) • FORMAL SELECTION PROCESSES • Needs to be more that a beauty contest • Jason and Beth had some impt. points
PRESENT BUT VAGUE • How to test performance of indicators during selection process • NOT the same for indictors used in AUDIT function and indicators used in CONTROL function • AUDIT – Targets primary, limits secondary • CONTROL – Limits primary, Targets 2ndary • METHODS EXIST FOR TESTNG BOTH
Present but Vague • Where do we get the reference points? • Differentiate Indicator [say, SSB] from Reference Points [Bmsy, B35% etc] • Reversibility of impact? Responsiveness to management at all? The “classic” three stage model should have ONE biological (or socio-economic) fixed point and the rest is making uncertainty explicit – NOT two biological fixed points.
More Critical Thinking, Perhaps? • When and how to use absolute vs relative indicators • Experience with IUCN decline criterion and marine species • Reference Points for different regimes • Pop Size NO; uses of populations YES • Especially if likelihood of prompt detection of regime change is low
More Critical Thinking, Perhaps? • If you like “traffic light-y” presentation, then biological calibration of cut-points is a crucial research topic • What to do with tough decisions and multiple indicators • EU experience with just B and F • US legislation on over-fishing and over-fished won’t transfer readily to ecosystem metrics
What other field works with Indicators in similar contexts? • PSYCHOMETRICS • SIMILARITIES • Fundamental underlying processes matter but are NOT accessible to direct measurement • INDIRECT indices proliferate quickly and (if flexible) easily • “Normal” is not a fixed point on ANY scale • A LOT hinges on decisions • Abuse and/or mis-interpretation is easy
Selection – Control function • SIGNAL DETECTION THEORY • From Human Factors Research • 70 year history (WWII was first flowering) • REQUIRES • Reconstruction of history of values of indicator(s) • RECONSTRUCTION OF HISTORY OF WHAT GOOD DECISIONS WOULD HAVE BEEN!!! • If we can’t do that retrospectively how can we support decision-making into the future
SIGNAL DETECTION THEORY • History of indicator gives direct record of what the decision would have been, had that indicator been used • History of what good decisions would have been gives standard for whether the decision IN HINDSIGHT would have been right or wrong • (Piet and Rice – Lower or not lower quota)
SIGNAL DETECTION THEORY • Four possible Outcomes: • HIT (something should have been done and Indicator said DO IT) • TRUE NEGATIVE (no mgmt response needed and indicator said status quo OK) • MISS (something should have been done but indicator did not say action was needed) • FALSE ALARM (nothing needed to be done but indicator called for management intervention)
SIGNAL DETECTION THEORY • Results presented as 2 X 2 tables • Perfect indicator has no Misses and False Alarms • COSTS of Misses and False Alarms not the same!!!! (nor equal to different perspectives) • Simple method to choose decision point on indicator (“reference point”) to • Minimize overall error rate • Control ratio of Misses and False Alarms (medical) • Easy to compare performance of Indicators
AUDIT FUNCTION- PSYCHOMETRIC DIAGNOSTICS • History of over a century • Many mistakes (and advocacy abuses), many lessons already learned • Uses are numerous • Career aptitude testing • Legal competency for actions • Personality disorders and counselling • Extensive validation testing and codification of professional standards
PSYCHOMETRIC DIAGNOSTICS • Reminder : Dealing with all the same problems: • Fundamental underlying processes matter but are NOT accessible to direct measurement • INDIRECT indices proliferate quickly and (if flexible) easily • “Normal” is not a fixed point on ANY scale • A LOT hinges on decisions • Abuse and/or mis-interpretation is easy
PSYCHOMETRIC DIAGNOSTICS • General Approach • Have large battery of “questions” (= “suites of indicators”) – Binet, MMPI, Rorschach etc • Test a large populace on the battery • Test sets of individuals KNOWN with confidence to have specific disorders. • WHAT COMBINATION OF QUESTIONS IN WHAT WEIGHTING MAXIMALLY GROUPS AS DISTINCT THE KNOWN PATHOLOGIES WHILE LEAVING MOST OF POPULACE IN A CENTRAL CLOUD • NOT TRIED IN ECOLOGY (that I know of)
The “Classic” three stage model CAUTIOUS HEALTHY CRITICAL HARVEST RATE CONVENTIONAL FISHERIES MANAGEMENT ENDANGERED SPECIES TOOLS WHERE IS SC? REBUILDING LRP ? EN TH BIOMASS
ONE Fixed Point in 3-stage model • Some govt responsibility – law or policy • “Serious or Irreversible harm” (CBD & PA) • 1. Best biological estimate of that point (ICES is Blim – damaged productivity) • 2. Estimating current status relative to that point has uncertainty, so buffer is needed- Bpa • Point where PROBABILITY that true stock may be at the limit is > 0.05 • Risk averse management relative to makes whole system precautionary • Gets F pairs from F which implies equilibrium Blim
The Issue of PREDICTABILITY • “Scenario Exploration” [use your favourite term] in Climate Change and Marine Ecosystem Dynamics have an important difference: • CC - NO EXPECTATION OF ACCURACY ON TIME SCALES >30 DAYS OR < 30 YEARS • ECOSYSTEM – 3-7(10?) YEAR PATTERN IS CORE OF DECISION SUPPORT • CC – key decisions are long-term strategic • Ecosystem “ “ medium-term tactical
What to Predict? • Don’t try to capture the inter-annual flutter • How does probability of a an extreme event (good or bad) vary with natural or anthropogenic forcers? • Multi-factor non-parametric probability density estimation methods DO show inflections in plot of P(extreme event) as f (specified forcers) • Easy to use and interpret • DO require decisions about what is “extreme”