Download
1 / 69
690 likes | 694 Views
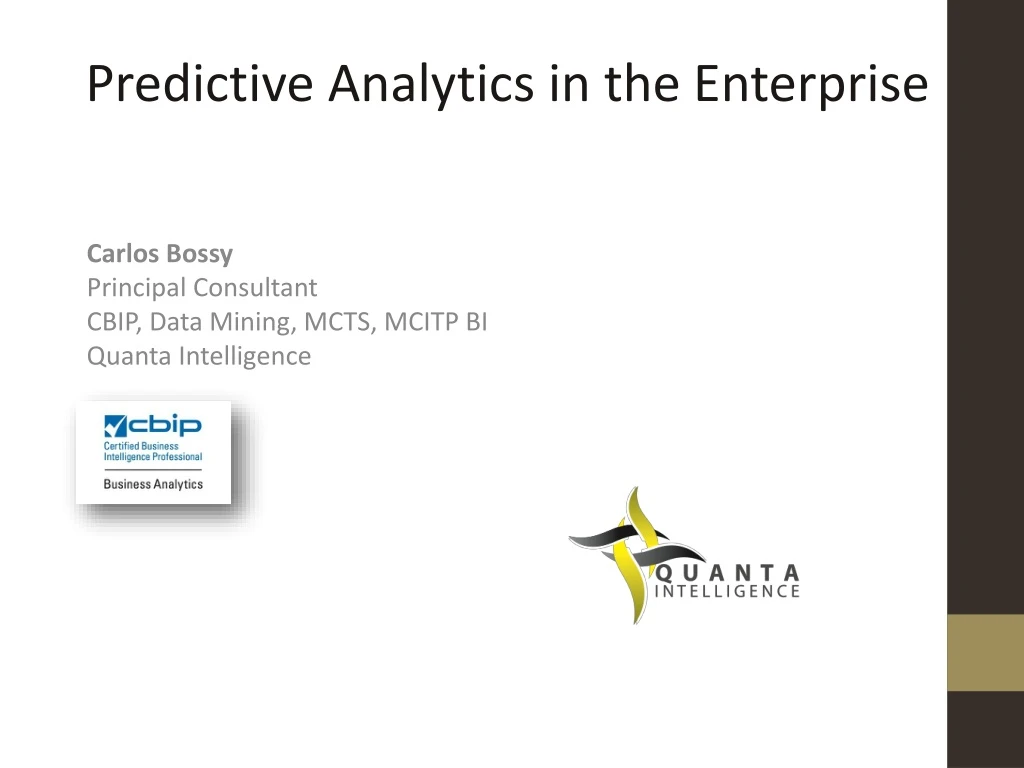
Predictive Analytics in the Enterprise. Carlos Bossy Principal Consultant CBIP, Data Mining, MCTS , MCITP BI Quanta Intelligence. Introduction. Experience. 10 years Business Intelligence Consultant Data Warehouse, Integration, Data Mining, Predictive Models

E N D
Predictive Analytics in the Enterprise Carlos Bossy Principal Consultant CBIP, Data Mining, MCTS, MCITP BI Quanta Intelligence
Introduction Experience • 10years Business Intelligence Consultant • Data Warehouse, Integration, Data Mining, Predictive Models • 15 years Software Development as Programmer thru CTO Speaker/Author • Speaker at PASS Summit in October • Local and Nationwide Events and Users Groups • Published Chapter on Big Data for Pro SQL Server 2012 Practices Contact Info • Email: cbossy@quantaintelligence.com • Blog: www.carlosbossy.com • Twitter: @carlosbossy
Math! Just a little….
Predictive Analytics Defined Predictive Analytics is the discovery of predictive information, sometimes hidden, from databases (often large) using related and unrelated data attributes by applying algorithmic analysis, and the creation of models that generate predictive results. • Predictive Modeling is the process of creating a model to best predict the probability of an outcome.
Data Scientist A Data Scientist incorporates techniques and theories from many fields, including mathematics, statistics, data engineering, pattern recognition and learning, advanced computing, visualization, uncertainty modeling, data warehousing, and high performance computing with the goal of extracting meaning from data. Data science:a novel term used interchangeably with competitive intelligence or business analytics.
The End What do we want to Achieve?
Predictive Analytics A vital component in the BI Data Architecture and available in real-time to Applications, Reports, ETL ROI of Business Analytics Projects when Incorporating Predictive Analytics (Source: IDC) 145% vs 89%
Yesterday <-----> Today Legacy Today • Manageable Volumes of Data • The ease and power of SQL • Domain Experts could grasp and analyze a complete Database • Limited CPU Horsepower • Finite Data • Explosion of Data doubles every 3 years (Moore’s Law) • Data Volumes can’t be comprehended by humans • Uncover complex and difficult to find patterns for competitive edge • Improve professional judgment of Domain Expert (small but valuable) • Knowledge Discovery • Converting Data to Information • N --> Infinity
Applications • Credit Risk Analysis • Churn Analysis • Customer Retention • Targeted Marketing • Market Basket Analysis • Sales Forecasting • Stock Predictions • Medical Diagnosis • Bioscience Research • Surveys • Insurance Rate Quotes • Credit Card Fraud • Web Site Events • Loan Applications • Hiring and Recruiting • Cross-Marketing • Attendance • Anything!
Terms to Know Class Variable is the data we are predicting. Instance and Attribute is similar to a row and column used as input to a predictive model. Support refers to the number of instances of a particular pattern. Overfitting (Overtraining) is a flaw in a predictive model where the model reflects the training data too closely. Confusion Matrix (Classification Matrix) is a table showing predicted values and their accuracy. Cross Validation is a way to develop and test a model by using a percentage of the data to test and another .
Event Management Model • How many people will register for an Event? Simultaneous events managed: > 100 Mean Error: 15% Target Error: 5% Pass 1: 60 days Pass 2: 30 days Pass 3: 7 days
Medical Case Management Workplace Injuries • Can a case benefit from Nurse Case Management intervention?
Prepare Data Transform the data to fit the Problem/Algorithm/Solutions Get derivations from SMEs, Data Analysis, Groupings Discrete vs. Continuous Binsand Buckets (discretize) Analyze Quantities: logarithmic, binary, linear Moving Averages: simple, exponential, convergence, divergence Input to Algorithm in Tabular Form
Choose Algorithm(s) • Random Forest • Model Tree • Genetic • Support Vector Machine • Many more … • Time Series • Naïve Bayes • Association • Clustering • Regression Tree • Logistic Regression • Clustering • Sequence Clustering • Neural Networks
Decision Tree Yearly Income = 64,387.383+5,984.161*(Cars-2.125)+9,372.900*(Age-60.313)+0.763*(ID-17,759.125)+20,740.055*(Children-0.125)
Model Training and Testing Predictive Model Applications
SQL Server Data Mining • SQL Server 2005 and 2008 • Analysis Services • SQL Server 2012 • Analysis Service Multi-Dimensional • Development • Business Intelligence Development Studio • Excel Data Mining Add-in
Event Registrations Model Development
Event Registrations • Daily Snapshot in Tabular Form
Event Registrations Predictive Model Outcome 30 Day Prediction
More Terms to Know (Advanced) Ensemble modeling combines the results of two or more independent models to improve the quality of predictions. Boosting (Bootstrapping) is a form of ensemble modeling that trains subsequent models byheavily weighting poorly classified instances. Bagging is also a form of ensemble modeling that trains each model in the ensemble using a random subset of the training data. The models then vote to obtain the best prediction. Stackingtrains a model by using as input the output of predictions of other models. Feature Selection is a process of selecting a subset of relevant data to reduce the amount of data a model must process to train. It can generalize a model and help avoid overfitting.
Workers’ Compensation • Model Development
Worker Injury Claims • Tabular Data View
More Terms and Things to Know Balancing of the training dataset is done to ensure class values occur in a similar proportion. Scoring is the output of a model (the predicted value). Model Disruption happens when an event occurs that causes a model to no longer make accurate predictions. Machine Learning is analogous to algorithmic predictive modeling. Expert Systems are developed using expertise and rules, not algorithms. Unstructured data such as text and images can be modeled to obtain information from the data.
Working Session Group Model • A Predictive Model • for Prospective Hires
Group Model Developing our Predictive Model • Problem Statement • Gather Data • Explore Data • Prepare Data • Training / Test Sets • Choose Algorithms • Train • Test
Group Model Problem Statement • Should we hire a job candidate? • What salary should we offer to a potential employee?
Group Model • Where’s the Data? Personality Type Certifications Experience References Leadership Integrity Evaluations Internet Search GPA Confidence Exams Interview Problem Solving Salary Requirements Job History
Group Model Building the Model
Model Development • Exercise #1 • New Project • SSAS Multidimensional and Data Mining Project • Set Properties • Server/Instance • Add Data Source with appropriate Impersonation Mode • Add Data Source View • Mining Structure • Defines the data we will use • Data must have a key • Ensure data types and content attribute are correct for each column • Column usage must be declared (Key, Input, Predict, PredictOnly) • Mining Model • One created through wizard • Create more mining models for each mining structure • Process and Run • Builds Models
Model Development • Exercise #1 • BI Studio (SQL Server Data Tools) • Visualization • Viewer (different for each algorithm) • Diagrams • Mining Legend • Mining Model Viewer • Mining Accuracy Chart • Lift Chart (Compare Models to random guesses and ideal model and to each other) • Classification Matrix (Confusion Matrix) • Cross Validation (90-10) • Mining Model Prediction
Model Development • Exercise #1 • Predict class of Iris plant from sepal length and width, petal length and width. • Dataset: iris table • Create:MiningStructurewith 30% holdout • AddMining Models: • Decision Tree • Neural Network • Logistic Regression • Cluster • Process / Test / Compare
Model Development • Exercise #1 • Visualizeand evaluate the quality of the models. • Dataset:iris table • Visuals • Mining Model Viewer • Mining Legend • Evaluate • Classification Matrix • Cross Validation • Mining Model Prediction
Model Development • Exercise #1 • Fine-tune the mining models by changing settings and parameters. • Dataset: iris table • Decision Tree • Change Minimum Support and view Classification Matrix • Explain Complexity Penalty for pruning and to prevent overfitting • Cluster • Cluster Count • Minimum Support • Change cluster count to 3 • Add another cluster mining model with cluster count set to 0 • Add one more with cluster count = 0 and modeling cardinality = 50
Tools What Analytics, Big Data, Data mining, Data Science software have you used in the past 12 months for a real project?
Tools – Excel • Data Exploration and Preparation Explore Data (data profiling) Discretization of Continuous Data Identify\Exclude Outliers Re-label (rename\map columns) Random Sampling to reduce size of Training Set Over Sampling for Balancing
Algorithm Differences Unsupervised: Cluster Algorithm Supervised: A class variable (prediction) is specified Classification: Predict a discrete variable Regression: Predict a continuous variable Time Series: Date driven predictions Association: Market Basket predictions
Lunch 1 Hour
Neural Network Algorithm New Weight = Weight + Error * Input * Learning Constant Multi-Layered…Feed Forward…Back Propagation