Download

1 / 63
630 likes | 646 Views
Learn about market equilibrium, price signals, and their impact on supply and demand. Explore topics such as surplus, shortage, bumper crops, and price floors. Understand the effects of government interventions and minimum wage laws.

E N D
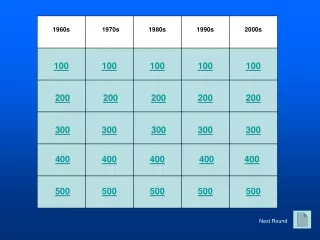
$100 $100 $100 $100 $100 $200 $200 $200 $200 $200 $300 $300 $300 $300 $300 $400 $400 $400 $400 $400 $500 $500 $500 $500 $500
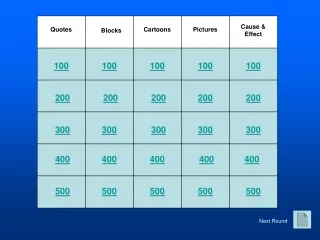
Prices as Signals Predicting Prices Distorting Prices Agricultural Price Supports Vocabulary $ $100 $100 $100 $100 $100 $200 $200 $200 $200 $200 $300 $300 $300 $300 $300 $400 $400 $400 $400 $400 $500 $500 $500 $500 $500
C 1 - $100 Situation where the quantity demanded is equal to the quantity supplied
C 1- $200 Price where the quantity supplied equals the quantity demanded
C 1- $300 Situation where quantity supplied is greater than quantity demanded at a given price
C 1- $400 Situation where quantity demanded is greater than quantity supplied at a given price
C 1- $500 In a market economy a high price is a signal for…
C 2 - $100 In a competitive market economy markets tend to run themselves to find this
C 2- $200 Term used to describe when a farmer grows a better than anticipated yield
C 2- $300 In the graph which curve represents the “bumper crop” yield for soybeans?
C 2- $400 What is the equilibrium price for the “worst case” yield of soybeans?
C 2- $500 Why do the changes in supply affect prices more in graph A? Graph A Graph B
C 3 - $100 Ticket that entitles the holder to a certain amount of a product
C 3- $200 Maximum legal price that can be charged for a product
C 3- $300 Lowest legal price that can be paid for a product
C 3- $400 Lowest legal wage that can be paid to most workes
C 3- $500 The federal minimum wage law demonstrates a trade-off between which two Socio-economic goals?
C 4 - $100 Price floor set to stabilize farm prices
C 4 - $200 Check sent to producers that makes up the difference between the actual market price and the target price
C 4 - $300 Agricultural loan that caries no penalty or further obligation if not repaid
C 4 - $400 This government agency established a target price to stabilize farm prices
C 4 - $500 This 1985 program paid farmers not to farm
C 5- $100 Monterey value of a product as determined by supply and demand
C 5 - $200 A simplified version of a complex behavior expressed in the form of an equation, graph, or illustration
C 5- $300 Partial refund of a product’s original price
C 5- $400 System of allocating goods and services without prices
C 5- $500 A dificiency payment is an example of a government payment to encourage an economic activity - which is called this economic term
C 1 A - $100 Market Equilibrium $
C 1 A- $200 Equilibrium Price $
C 1 A- $300 Surplus $
C 1 A- $400 Shortage $
C 1 A- $500 Producers to supply more and consumers to buy less $
C 2 A- $100 Equilibrium or Market Equilibrium $
C 2 A- $200 Bumper Crop $
C 2 A- $300 Curve S1 $
C 2 A- $400 $10 a bushel $
C 2 A- $500 The Demand Curve “A” is Inelastic Graph A Graph B $
C 3 A - $100 Ration Coupon $
C 3 A - $200 Price Ceiling $
C 3 A - $300 Price Floor $
C 3 A - $400 Minimum Wage $
C 3 A - $500 Economic Equity Over Economic Efficiency $
C 4 A - $100 Target Price $
C 4 A - $200 Deficiency Payment $