Download

1 / 24
240 likes | 250 Views
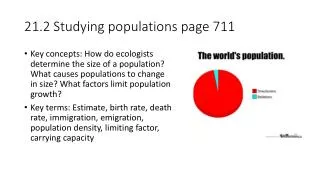
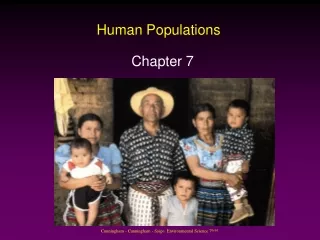
Studying Human Populations. Demography is the study of the characteristics of populations, especially human populations. Demographers study the historical size and makeup of the populations of countries to make comparisons and predictions.

E N D
Studying Human Populations • Demographyis the study of the characteristics of populations, especially human populations. • Demographers study the historical size and makeup of the populations of countries to make comparisons and predictions. • Demographers also study properties that affect population growth, such as economics and social structure.
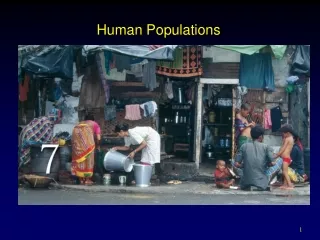
Studying Human Populations • Countries with similar population trends are often grouped into two general categories: developed and developing countries. • Developed countries have higher average incomes, slower population growth, diverse industrial economies, and stronger social support systems. • Developing countries have lower average incomes, simple and agriculture-based economics, and rapid population growth.
The Human Population Over Time • The human population underwent exponential growth in the 1800s, meaning that the population growth rates increased during each decade. • These increases were mostly due to increases in food production and improvements in hygiene that came with the industrial and scientific revolution. • However, it is unlikely that the Earth can sustain this growth for much longer.
Age Structure • Age structureis the classification of members of a population into groups according to age or the distribution of members of a population in terms of age groups and helps demographers make predictions. • Countries that have high rates of growth usually have more young people than older people. • In contrast, countries that have slow growth or no growth usually have an even distribution of ages in the population.
Age Structure • Age structure can be graphed in a population pyramid, a type of double sided bar graph. • The figure on the following slide shows typical age structures for countries that have different rates of growth.
Survivorship • Survivorshipis the percentage of newborn individuals in a population that can be expected to survive to a given age. • It is used as another way to predict population trends. • To predict survivorship, demographers study a group of people born at the same time and notes when each member of the group dies.
Survivorship • The results of these studies are then plotted on a graph and might look like one of the types of survivorship graphs below.
Survivorship • Wealthy developed countries such as Japan and Germany currently have a Type I survivorship curve because most people live to be very old. • Type II populations have a similar death rate at all ages. • Type III survivorship is the pattern in which many offspring die. • Both Type I and Type III may result in populations that remain the same size or grow slowly.
Fertility Rates • A fertility rateis the number of births (usually per year) per 1,000 women of childbearing age (usually 15 to 44). • Replacement level is the average number of children each parent must have in order to “replace” themselves. This number is slightly more than 2 because not all children born will survive and reproduce.
Fertility Rates • A graph of historical fertility rates for the United States is shown on the next slide. • In 1972, the total fertility dropped below replacement level for the first time in US History. • Fertility rates remained below replacement level for most of the 1990s, but recently has been growing partly because the children of the baby boom grew up and had children.
Migration • Migrationin general, is any movement of individuals or populations from one location to another. • Movement into an area is immigration and movement out of an area is emigration. • The populations of many developed countries might be decreasing if not for immigration.
Migration • Migration between and within countries is a significant part of population change.
Declining Death Rates • The dramatic increase in Earth’s human population in the last 200 years has happened because death rates have declined more rapidly than birth rates. • Death rates have declined because more people now have access to adequate food, clean water, and safe sewage disposal. • The discovery of vaccines in the 20th century also contributed to the declining death rates.
Life Expectancy • Life expectancyis the average length of time that an individual is expected to live. • Life expectancy is most affected by infant mortality, the death rate of infants less than a year old. • Expensive medical care is not necessarily helpful in preventing infant deaths. Infant health is more affected by the parents’ access to education, food, fuel, and clean water.
Life Expectancy • The graph shows that average life expectancy worldwide has increased to more than 67 years old. But, new threats, such as tuberculosis and AIDS are arising as populations become denser.
The Demographic Transition • The demographic transitionis the general pattern of demographic change from high birth and death rates to low birth and death rates, and observed in the history of more-developed countries. • The theory behind the demographic transition is that industrial development causes economic and social progress that then affects population growth rates.
Stages of the Transition • In the first stage of the demographic transition: a society is in a preindustrial condition. The birth rate and the death rate are both high and the population size is stable. • In the second stage, a population explosion occurs. Death rates decline as hygiene, nutrition, and education improve. But, birth rates remain high, so the population grows very fast.
Stages of the Transition • In the third stage, population growth slows because birth rate decreases. As the birth rate becomes close to the death rate, the population size stabilizes. • In the fourth stage, the birth rate drops below replacement level, so the size of the population begins to decrease. • It can take from one to three generations for the demographic transition to occur.
Women and Fertility • The factors most clearly related to a decline in birth rates are increasing education and economic independence for women. • In the demographic transition model, the lower death rate of the second stage is usually the result of increased levels of education. • Educated women find that they do not need to bear as many children to ensure that some will survive. They may also learn family planning techniques.
Women and Fertility • Women are able to contribute to their family’s increasing prosperity while spending less energy bearing and caring for children. • As countries modernize, parents are more likely to work away from home. If parents must pay for child care, children may become a financial burden rather than an asset. • All of these reasons contribute to lower birth rates in both developed and developing countries.