Download
1 / 21
210 likes | 215 Views
Learn how to graph absolute value functions and apply transformations using translations, reflections, stretches, and shrinks. Also, explore the relationship between different functions within the absolute value family.

E N D
2.7 - Absolute Value Functions and Transformations Objectives: • To graph an absolute value function by performing transformations on the parent • To apply transformations to graphing any function
Vocabulary As a group, define each of these without your book. Give an example of each word and leave a bit of space for additions and revisions.
The Absolute Value Function The absolute value function is defined by f (x) = |x|. This is the absolute value parent function.
Parent Function • V-shape • It is symmetric about the y-axis • The vertexis the minimum point on the graph
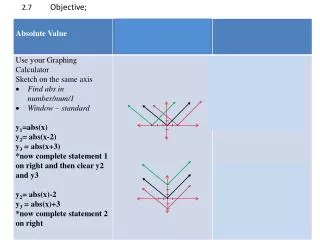
Investigation 1 In this Investigation, we are going to discover how to perform transformations on the absolute value function. Step 1: Press Y= and enter the following equations.
Investigation 1 Step 2:Graph the equations using the ZOOMSTD setting. Step 3:Describe how the family of graphs y = |x| + k is related to y = |x|.
Investigation 1 Step 4: Press Y= and enter the following equations. Step 5: Graph the equations using the ZOOMSTD setting.
Investigation 1 Step 6: Describe how the family of graphs y = |x – h | is related to y = |x|.
Translation A translation is a transformation that shifts a graph horizontally or vertically, but doesn’t change the overall shape or orientation.
Translation The graph of y = |x – h| + k is the graph of y = |x| translated h horizontal units and y vertical units. • The new vertex is at (h, k)
Investigation 2 In this Investigation, we will continue to expand our knowledge of transformations. Step 1: Press Y= and enter the following equations.
Investigation 2 Step 2:Graph the equations using the ZOOMSTD setting. Step 3:Describe how the family of graphs y = a|x| is related to y = |x|.
Stretching and Shrinking The graph of y = a|x| is graph of y = |x| vertically stretched or shrunk depending on the |a|. The value of a acts like the slope.
Exercise 1 Use your graphing calculator to graph the following: • y = |x| • y = -|x| Describe how the graph of y = a|x| is related to y = |x| when a < 0.
Reflection The graph of y = a|x| is graph of y = |x| reflected across the x-axis when a < 0.
Multiple Transformations In general, the graph of an absolute value function of the form y = a|x – h| + kcan involve translations, reflections, stretches or shrinks. To graph an absolute value function, start by identifying the vertex.
Graphing Absolute Value Functions Graphing y = a|x – h| + kthese things is easy: • Plot the vertex (h, k). • Use the a value as slope to plot one point. • Use symmetry to find a corresponding point. • Connect the dots in a V-shape.
Exercise 2 Without a graphing calculator, graph the following functions. How do they compare to the parent function? • y = |x – 2| + 5 • y = (1/2)|x| • y = 2|x + 1| – 3 • f (x) = -3|x + 1| – 2
Transformations in General You can perform transformations on the graph of any function in manner similar to transformations on the absolute value function.
Exercise 3 The graph of y = f (x) is shown. Sketch the graph of the given function. • y = 2 f (x) • y = -f (x + 2) + 1 • y = 2 f (x – 2) – 5
Assignment • P. 127-129: 1, 2-32 even, 33, 34, 39, 42-44 • P. 131: 1-10 • Working with Other Functions Worksheet: Evens