Download
1 / 23
230 likes | 235 Views
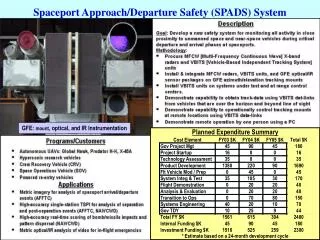
Roadway Departure Safety Basics. Roadway Departure Safety Basics. Ken Kochevar , PE, Safety Program Manager, FHWA California Division Office David Ragland, PhD, MPH, Co-Director, U.C. Berkeley, Safe Transportation Research and Education Center ( SafeTREC ). Fatalities in the USA.

E N D
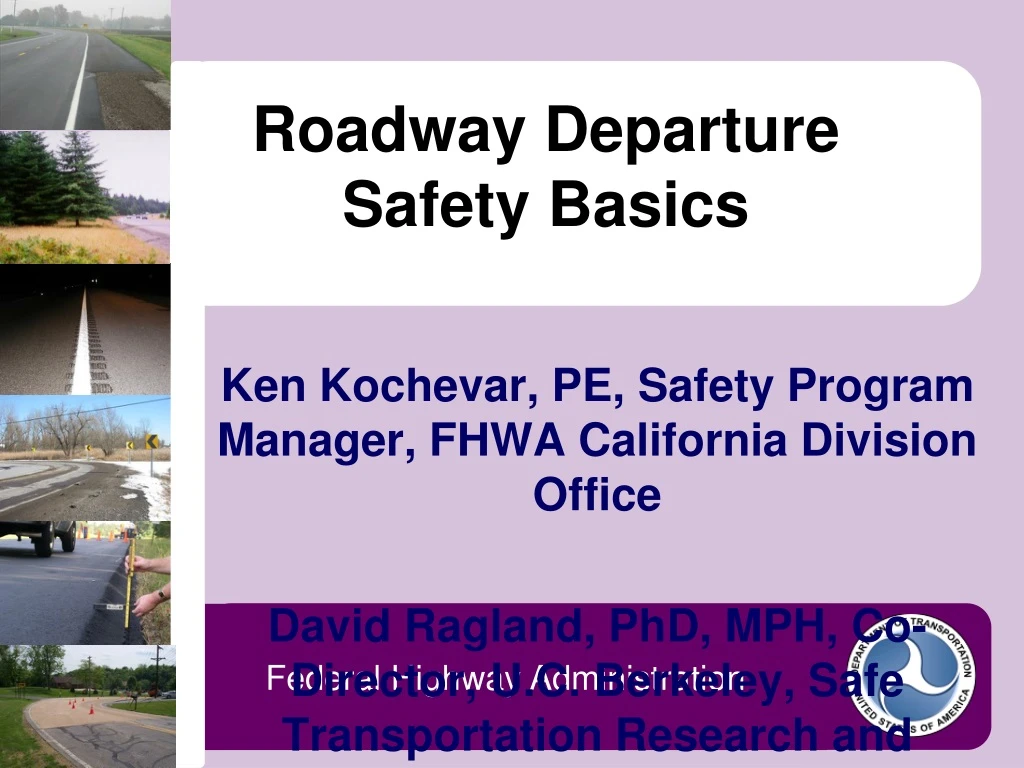
Roadway Departure Safety Basics Roadway Departure Safety Basics Ken Kochevar, PE, Safety Program Manager, FHWA California Division Office David Ragland, PhD, MPH, Co-Director, U.C. Berkeley, Safe Transportation Research and Education Center (SafeTREC)
Fatalities in the USA. Fatalities in the USA • (2013 - 2015 Average) 115 (NH) 489 57 (VT) 144 215 National Average – 33,576 Fatalities 138 386 372 337 (MA) 205 538 1,121 135 127 54 (RI) 937 267 (CT) 1,202 320 553 (NJ) 227 1,035 294 116 (DE) 783 251 971 3,128 505 291 732 363 797 473 (MD) 690 1,318 972 22 (DC) 838 663 500 332 856 632 841 1,258 2,612 3,480 723 63 > 1500 average fatalities 97 751-1500 average fatalities 150-750 average fatalities Data Source: NHTSA FARS < 150 average fatalities
AASHTO Strategic Plan Strategic Objective Promote highway-related strategies to assist in cutting fatalities by half by 2030 with a vision towards zero fatalities.
Roadway Departure Fatalities Percent • (2013 - 2015 Average) Roadway Departure Fatalities Percent National Average RwD % = 54% 74 (NH) 60 82 (VT) 75 73 65 52 57 (MA) 62 68 47 62 67 52 (RI) 73 49 57 (CT) 62 44 (NJ) 60 63 60 42 (DE) 43 55 49 53 46 58 73 48 (MD) 65 64 60 66 27 (DC) 59 62 58 42 47 66 59 54 64 60 60 53 38 > 70% average 59 61% - 70% average 54% - 60% average 48 < 54% average
Overturn Crashes Source: FARS 2010-2013
Opposite Direction Crashes NCHRP Report 500, Volume 6 Reported that only 4.2% of head-ons involved a passing vehicle. Source: FARS 2010-2013
Fixed Object Fatal Crashes Trees are 48% of Fixed Object Fatalities Source: FARS 2010-2013
Tree Crashes Trees 19% Trees Source: FARS 2010-2013 Trees are 48% of Fixed Object Fatalities
So, why do drivers leave the road? • Roadway Condition • Collision Avoidance • Vehicle Component Failure • Driver Error
Crashes Caused by Various Factors: Systems Approach 3% 27% 57% Driver 93% Roadway 34% 3% 1% 6% Human is weakest link in this system, so we must design around human needs. Vehicle 12% 2% FROM: Lum & Reagan, Public Roads Magazine, Winter 1995, “Interactive Highway Safety Design Module”
Example of a RwD Crash Map • Look at Fatal Crashes plotted in rural San Diego County California over five years (2012 through 2016) • Can you see a place that needs to be treated?
San Diego RD Fatal Collision Mapping for 2012[Roadway Departure-Rural: non_state_highway]
San Diego RD Fatal Collision Mapping for 2013[Roadway Departure-Rural: non_state_highway]
San Diego RD Fatal Collision Mapping for 2014[Roadway Departure-Rural: non_state_highway]
San Diego RD Fatal Collision Mapping for 2015[Roadway Departure-Rural: non_state_highway]
San Diego RD Fatal Collision Mapping for 2016[Roadway Departure-Rural: non_state_highway]
Fatal Crash Locations. fatal crash locations are random
fatal crash types are predictable fatal crash types are predictable
Characteristics of Crashes • Determine similarities along a roadway or corridor: • Geometry (e.g., straight vs. curves) • Speed (e.g., 35 mph vs. 60 mph) • Environment (e.g., trees, shade, clear zone) • ADT (e.g., 400 vs. 3,700) • Vehicle type (e.g., trucks, cars, motorcycles, bicyclists, pedestrians)
Systemic Countermeasures • Systemic: Applying throughout or system-wide coverage • Consider applying proven countermeasures: • Rumble Strips • Signage • High Friction Surface Treatments • Enf./Ed. • Proactive vs. Reactive