Download
1 / 46
470 likes | 475 Views
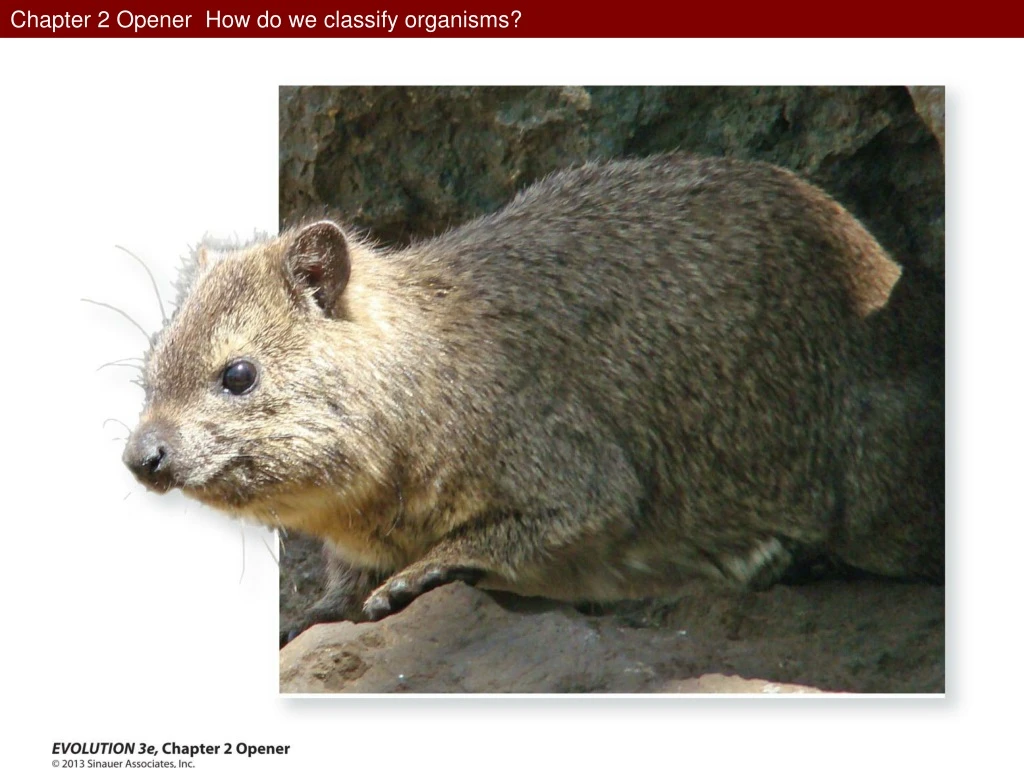
Chapter 2 Opener How do we classify organisms?. Figure 2.1 Tracing the path of evolution to Homo sapiens from the universal ancestor of all life. Figure 2.2 The tree of life. Figure 2.3 Darwin’s representation of hypothetical phylogenetic relationships.

E N D
Figure 2.1 Tracing the path of evolution to Homo sapiens from the universal ancestor of all life
Figure 2.3 Darwin’s representation of hypothetical phylogenetic relationships
Figure 2.4 A phylogenetic tree of human, chimpanzee, and bonobo taxa, illustrating major phylogenetic terms
Figure 2.6 Phylogenetic analyses often use unrooted trees, which are converted to rooted trees
Figure 2.7 Phylogenetic analysis has revealed the relationships of some formerly puzzling organisms
Figure 2.8 Phylogenetically informative and uninformative similarities among species
Figure 2.9 Monophyletic groups whose members share derived character states that evolved only once
Figure 2.9 Monophyletic groups whose members share derived character states that evolved only once
Figure 2.10 Two possible hypotheses for the phylogenetic relationships of humans
Figure 2.10 Two possible hypotheses for the phylogenetic relationships of humans
Figure 2.11 Steps in a phylogenetic analysis using the maximum parsimony method
Figure 2.13 Evidence for phylogenetic relationships among primates
Figure 2.13 Evidence for phylogenetic relationships among primates
Figure 2.14 How long branches can lead a parsimony analysis astray
Figure 2.14 How long branches can lead a parsimony analysis astray (Part 1)
Figure 2.14 How long branches can lead a parsimony analysis astray (Part 2)
Figure 2.15 A two-parameter model in which the rate of transition differs from the rate of transversion
Figure 2.16 Relationships among hominoid primates, based on a maximum likelihood analysis of sequences of two genes
Figure 2.17 The true phylogeny of the experimental populations of T7 bacteriophage studied by Hillis et al.
Figure 2.17 The true phylogeny of the experimental populations of T7 bacteriophage studied by Hillis et al.
Figure 2.18 Relationships among vertebrates, as estimated from morphological characters and DNA sequences
Figure 2.19 Base pair differences ´ time since divergence suggests a fairly constant rate of sequence evolution
Figure 2.19 Base pair differences ´ time since divergence suggests a fairly constant rate of sequence evolution
Figure 2.20 The relative rate test for constancy of the rate of molecular divergence
Figure 2.21 Proportions of base pairs at different codon positions in the DNA sequences of COI that differ between vertebrate species pairs, against time since their most recent common ancestor
Figure 2.21 Proportions of base pairs at different codon positions in the DNA sequences of COI that differ between vertebrate species pairs, against time since their most recent common ancestor
Figure 2.22 Results of a study of divergence times for some lineages of primates
Figure 2.23 Relationships among haplotypes of the mitochondrial cytochrome b gene in MacGillivray’s warbler
Figure 2.23 Relationships among haplotypes of the mitochondrial cytochrome b gene in MacGillivray’s warbler
Figure 2.25 A gene tree may or may not reflect the true phylogeny of the species from which the genes are sampled
Figure 2.25 A gene tree may or may not reflect the true phylogeny of the species from which the genes are sampled
Figure 2.25 A gene tree may or may not reflect the true phylogeny of the species from which the genes are sampled (Part 1)
Figure 2.25 A gene tree may or may not reflect the true phylogeny of the species from which the genes are sampled (Part 2)
Figure 2.25 A gene tree may or may not reflect the true phylogeny of the species from which the genes are sampled (Part 3)
Figure 2.26 Four species of grasshoppers inferred from multiple samples of each of six genes in each species
Figure 2.27 Relationships among 11 species of placental mammals, which represent four major clades
Figure 2.30 Chimpanzees and gorillas carry several clades of the parasite Plasmodium, from which human P. falciparum is derived