Download
1 / 44
450 likes | 611 Views
Respiratory tract anatomy. fig 13-1. Conducting zone vs. respiratory zone. fig 13-2. Conducting zone functions. Regulation of air flow trachea & bronchi held open by cartilaginous rings smooth muscle in walls of bronchioles & alveolar ducts

E N D
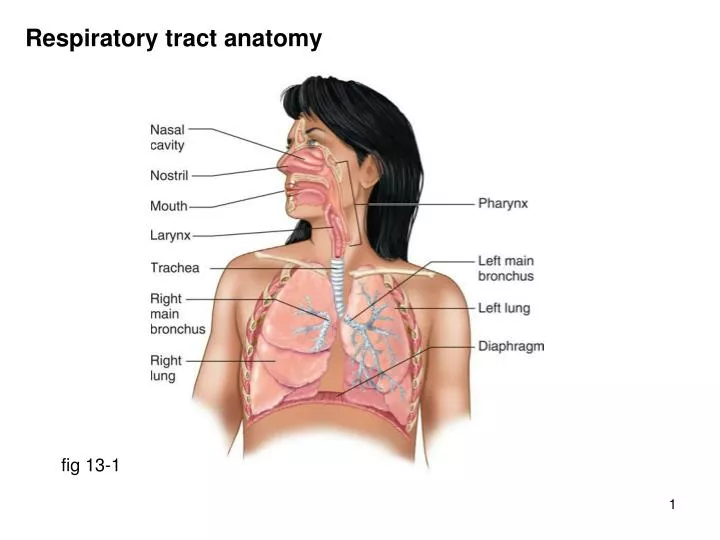
Respiratory tract anatomy fig 13-1
Conducting zone vs. respiratory zone fig 13-2
Conducting zone functions Regulation of air flow trachea & bronchi held open by cartilaginous rings smooth muscle in walls of bronchioles & alveolar ducts sympathetic NS & epinephrine relaxation ( receptors) air flow leukotrienes (inflammation & allergens leukotrienes mucus & constriction) Protection mucus escalator (goblet cells in bronchioles & ciliated epithelium) inhibited by cigarette smoke Warming & humidifying inspired air expired air is 37 & 100% humidity (loss of ~400 ml pure water/day) Phonation larynx & vocal cords
Alveolar structure 1 fig 13-3b
Alveolar structure 2 fig 13-4a
Alveolar structure 3 fig 13-4b
Alveolar structure (notes) Type I epithelial cells thin, flat; gas exchange Type II epithelial cells secrete pulmonary surfactant pulmonary compliance (later) Pulmonary capillaries completely surround each alveolus; “sheet” of blood Interstitial space diffusion distance for O2 & CO2 is less than diameter of red blood cell Elastic fibers secreted by fibroblasts into pulmonary interstitial space tend to collapse lung
Lung pressures Lungs are inflated by being “pulled” open Transmural/transpulmonary pressure = Palveolar – Ppleural = 0 – (-5) = 5 mm Hg
Lung pressures during ventilation Purple line: alveolar pressure (Palv) -1 mm Hg during inspiration +1 mm Hg during expiration Green line: pleural pressure (Pip) -4 mm Hg at functional residual capacity -7 mm Hg after inspiration Ptp is transpulmonary (transmural) pressure i.e. Palv – Pip (e.g. at “2”, -1 – (-5) = 4 mm Hg Lower curve (black): labeling accidentally omitted x axis should read “4 sec” i.e. time y axis is tidal volume = 500 ml
Pleural pressure during ventilation Quiet ventilation: pleural pressure (Pip) always negative as lung expands, Pip becomes more negative because recoil (collapsing) force increases as lung stretches Forced ventilation: Pip negative during inspiration; more negative as lung expands Pip can be positive during forced expiration (e.g. FEV1 measurement)
Airway resistance Transpulmonary pressure as lungs expand, pleural pressure becomes more negative transpulmonary pressure (alveolar pressure – pleural pressure) increases alveoli expand, bronchioles expand airway resistance result: inhalation lowers resistance, exhalation increases resistance Lateral traction alveoli & bronchioles all interconnected expansion of lungs stretches alveoli & bronchioles resistance net stocking metaphor
Lung compliance Definition: ease of expansion e.g. balloon is compliant, auto tire is less compliant i.e. tire requires much greater pressure increase to expand compliance = Δ volume / Δ pressure Factors that decrease compliance surface tension of fluid lining alveolar surface elastic tissue in alveolar walls expansion of lungs (stretched lungs are less compliant) Factors that increase compliance pulmonary surfactant secreted by type II alveolar cells reduces surface tension of alveolar fluid mixture of phospholipid and protein low levels in premature infants (respiratory distress syndrome)
Airway resistance Epinephrine relaxes bronchiolar smooth muscle (2 receptors) Leukotrienes released during the inflammatory response contract bronchiolar smooth muscle important in asthma & bronchitis
Lung volumes Learn in laboratory: *tidal volume, *inspiratory reserve volume, *expiratory reserve volume, residual volume, functional residual capacity, *vital capacity, total lung capacity *can be measured with a spirometer FEV1: forced vital capacity in 1 second (~80%) Functional residual capacity: lung volume when all muscles are relaxed (or subject is dead) lung volume at the end of quiet expiration tendency of lungs to collapse = tendency of thoracic cavity to expand pleural pressure is negative (~ -4 mm Hg)
Alveolar ventilation Minute ventilation tidal volume (ml/breath) x respiratory rate (breaths/min) Anatomic dead space space in respiratory tract where no gas exchange occurs fig 13-20
Alveolar ventilation fresh air entering lung with each breath = tidal volume – dead space Alveolar ventilation rate (tidal volume – dead space) x respiratory rate Example calculations see also table 13-5
Partial pressures Dalton’s law In a mixture of gases, each gas behaves independently and exerts a pressure proportional to its concentration in the gas mixture For example: Air is 79% N2, 21% O2, 0.4% CO2 Air pressure = 760 mm Hg (dry air at sea level) P.N2 = 600 mm Hg, P.O2 = 160 mm Hg, P.CO2 = 0.3 mm Hg Partial pressure in solution = partial pressure in gas mixture after equilibration with solution Why use partial pressures? because gases diffuse down their partial pressure gradients (in gas or in solution)
Partial pressures at various sites fig 13-22
Partial pressure & solubility because P.O2 plasma = P.O2 blood, putting them in contact, separated by O2 permeable membrane no net diffusion
Alveolar gas composition as AVR varies Hypoventilation: alveolar ventilation rate Hyperventilation: alveolar ventilation rate
Ventilation (air flow) & perfusion (blood flow) matching If air flow to an alveolus is blocked: alveolar gas = venous blood (P.O2 40 mm Hg, P.CO2 45 mm Hg) The P.O2 signals constriction of blood vessels (hypoxic vasoconstriction) i.e. don’t send blood to an alveolus with no air flow If blood flow to an alveolus is blocked: alveolar gas = atmospheric air (P.O2 160 mm Hg, P.CO2 ~0 mm Hg) The P.CO2 signals constriction of bronchioles i.e. don’t send air to an alveolus with no blood flow
Alveolar O2 pulmonary capillary blood fig 13-24 Diseased lung: pulmonary edema, interstitial fibrosis
Hemoglobin structure 4 subunits (left) form 1 hemoglobin Iron is ferrous form (Fe++) Hb + 4 O2 Hb(O2)4 (saturated) deoxyHb oxyHb fig 13-26
Oxygen-hemoglobin dissociation curve fig 13-27
Oxygen-hemoglobin dissociation curve (notes) 100% saturation is when every Hb has 4 O2’s bound Sigmoid (S-shaped) curve indicates that binding of the 1st O2 increases the affinity of the other Hb binding sites for O2 (an allosteric effect technically known as “positive cooperativity”) Sigmoid curve means that the curve is steepest in the region of unloading O2 i.e. in the tissues where P.O2 is < 40 mm Hg A steep curve means that a small reduction in P.O2 O2 unloaded Curve is flattest in the lung where P.O2 is ~100 mm Hg A flat curve means that a large reduction in P.O2 reduction in O2 saturation of Hb (e.g. at high altitude or in diseased lung) Also, flat curve means breathing 100% O2 adds little O2 to the blood
O2-Hb curve; effect of pH, CO2, DPG, temperature In working tissue, pH, P.CO2, temperature, DPG DPG is diphosphoglycerate (now known as bisphosphoglycerate) DPG is in hypoxic tissue (and in stored blood in blood banks)
O2 from alveolus red blood cell in the lung all O2 movement is by simple diffusion down its partial pressure gradient fig 13-29
O2 from rbc Hb cells all O2 movement is by simple diffusion down its partial pressure gradient highest P.O2 in alveolus lowest P.O2 in mitochondria fig 13-29
CO2 from tissues blood CO2 transport: 60% plasma HCO3- 30% carbamino hemoglobin 10% dissolved CO2 CA = carbonic anhydrase H2O + CO2 H2CO3 fig 13-31a
CO2 from pulmonary blood alveolus CO2 transport: 60% plasma HCO3- 30% carbamino hemoglobin 10% dissolved CO2 CA = carbonic anhydrase H2O + CO2 H2CO3 fig 13-31b
Hemoglobin as a buffer Notes on next slide fig 13-32
Hemoglobin as a buffer (notes) In tissues: CO2 (produced by metabolism) + H2O H2CO3 H+ + HCO3- Hemoglobin becomes more basic when it is deoxygenated, i.e. it binds H+ more tightly In the lung: Hemoglobin is oxygenated, becomes more acidic, (i.e. it is a more powerful H+ donor), and releases its H+ H+ + HCO3- H2CO3 H2O + CO2 (released into alveolus)
Rhythmical nature of breathing Respiratory rhythm generator located in medulla oblongata of brainstem During quiet breathing Inspiration: action potentials burst to diaphragm & inspiratory intercostals Expiration: no action potentials; elastic recoil of lungs (passive process) During forced breathing (e.g. exercise, blowing up a balloon) Active inspiration & expiration Expiration with expiratory intercostals & abdominal muscles Breathing is also modulated by centers in pons of brainstem & lungs
Control of ventilation (chemoreceptors) peripheral chemoreceptors in carotid & aortic bodies Central chemoreceptors: in medulla (brain interstitial fluid) Stimulated by: 1. P.CO2 (via pH: most important) Peripheral chemoreceptors: see left (arterial blood) Stimulated by: 1. P.CO2 (via pH) 2. P.O2 3. pH fig 13-33
Control of ventilation ( arterial P.O2) fig 13-34 Acts on peripheral chemoreceptors ( P.O2 depresses central chemoreceptors) relatively insensitive (potentiated by P.CO2) responds to P.O2, not O2 content (i.e. not to anemia or CO poisoning)
Control of ventilation ( arterial P.O2) fig 13-35
Control of ventilation ( P.CO2) Acts on central & peripheral chemoreceptors central chemoreceptors are the most important regulators of ventilation acts via [H+] (pH) note sensitivity fig 13-36
Control of ventilation ( P.CO2) fig 13-37
Control of ventilation ( pH) fig 13-38 P.CO2 acts via pH, but this is pH from other sources (e.g. lactic acid)
Control of ventilation ( pH) fig 13-39
Increased ventilation & exercise You would think that exercise AVR by CO2, O2, or pH However: fig 13-41
Increased ventilation & exercise; possible mechanisms fig 13-43 Also: axon collaterals from descending tracts to respiratory centers feedback from joints & muscles